Sign up for the next @RStudio Webinar on adding advanced interactivity to your shiny app with #plotly and event_data().
"Accessing and responding to plotly events in Shiny" with Carson Sievert
Reserve your spot now:
#rstats
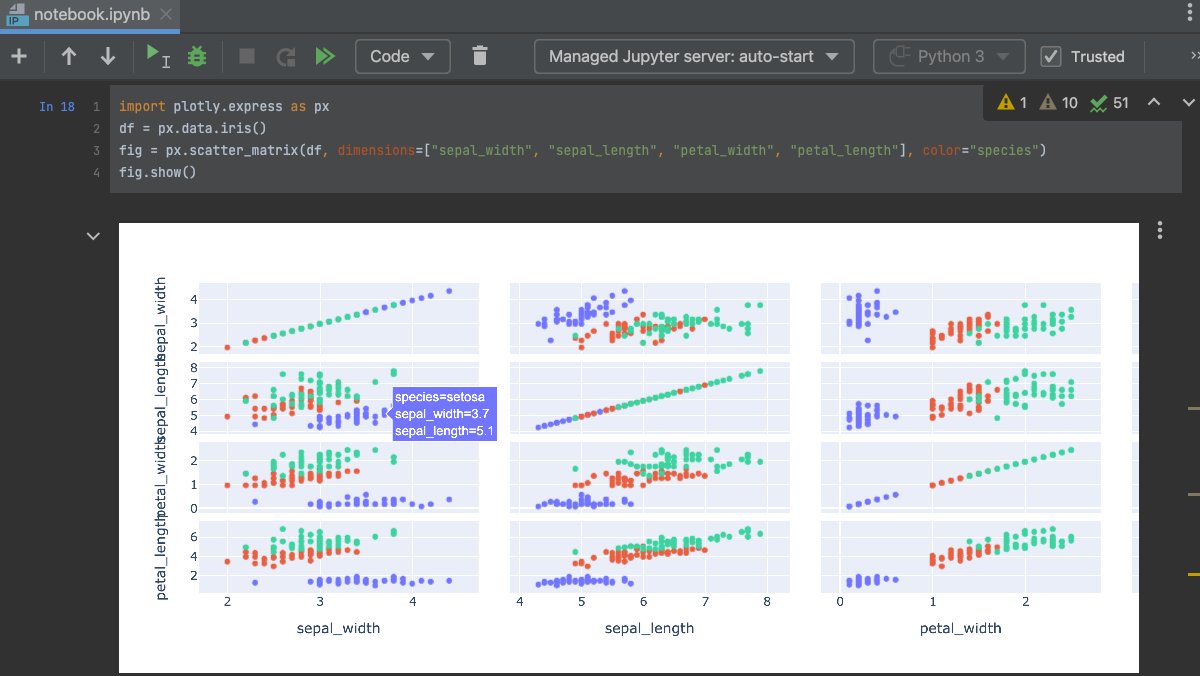
PyCharm Pro now has full support for both static and JavaScript-based outputs used by popular scientific libraries such as #Plotly, Bokeh, #Altair, ipywidgets, and more.
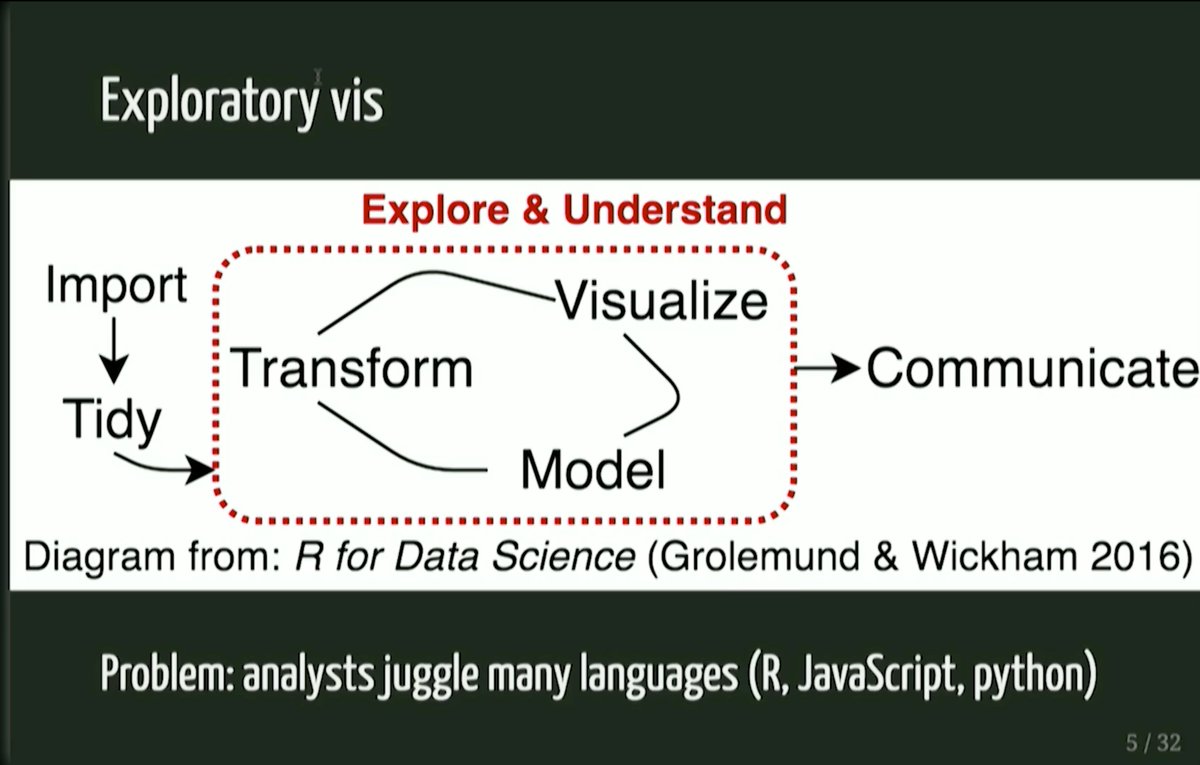
Watch Carson Sievert talk about Creating Interactive Web Graphics for Exploratory Data Analysis. Interactive plots can be tricky to dev & less-popular exploratory analysis. But that's less and less so now
@cpsievert@plotlygraphs#rstudioconf#plotly
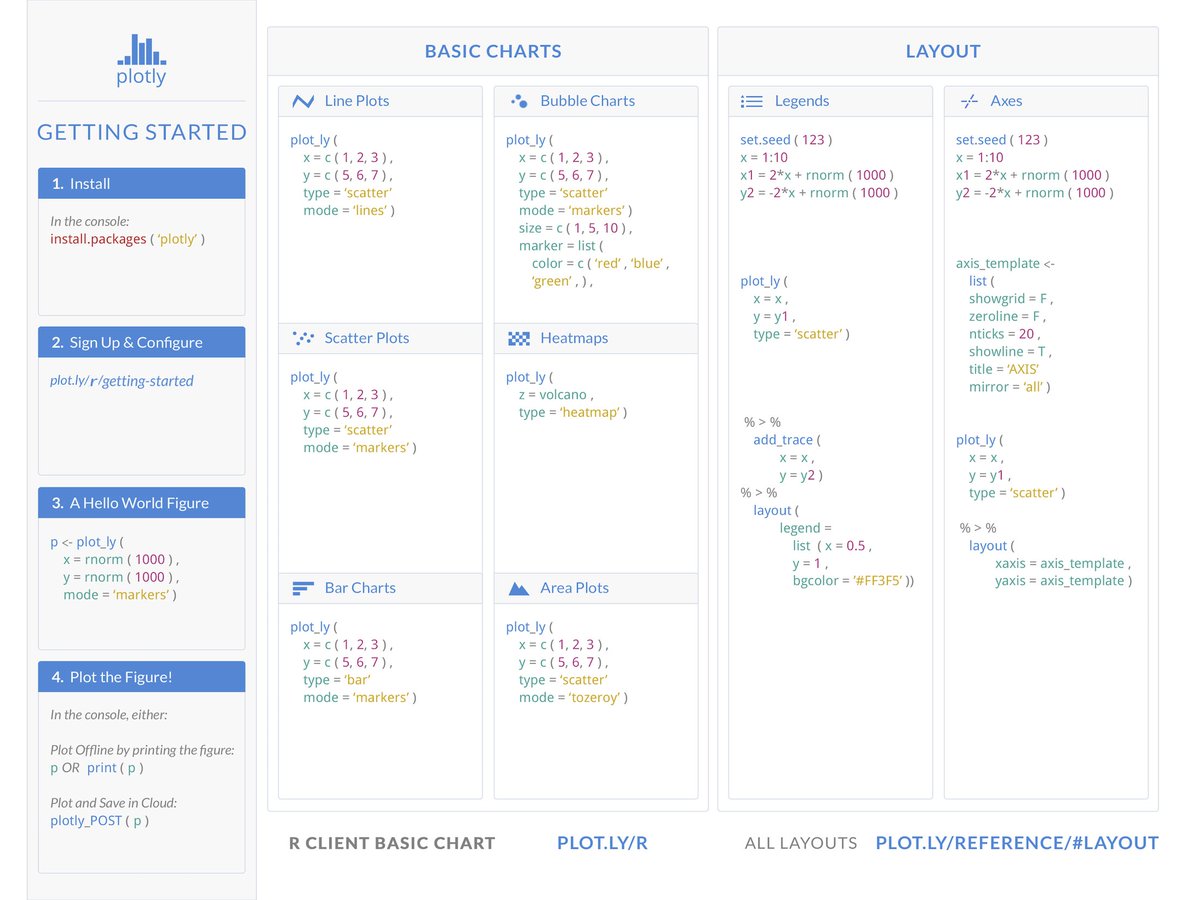
Plotly is one of the finest data visualization tools available built on top of visualization library D3.js, HTML and CSS - let's learn how to use #Plotly library in #R & #Python to create beautiful, interactive data #visualizations!!!
Super excited to show some brand-new #rstats+#shiny+#plotly developments and examples in tomorrow's @rstudio webinar.
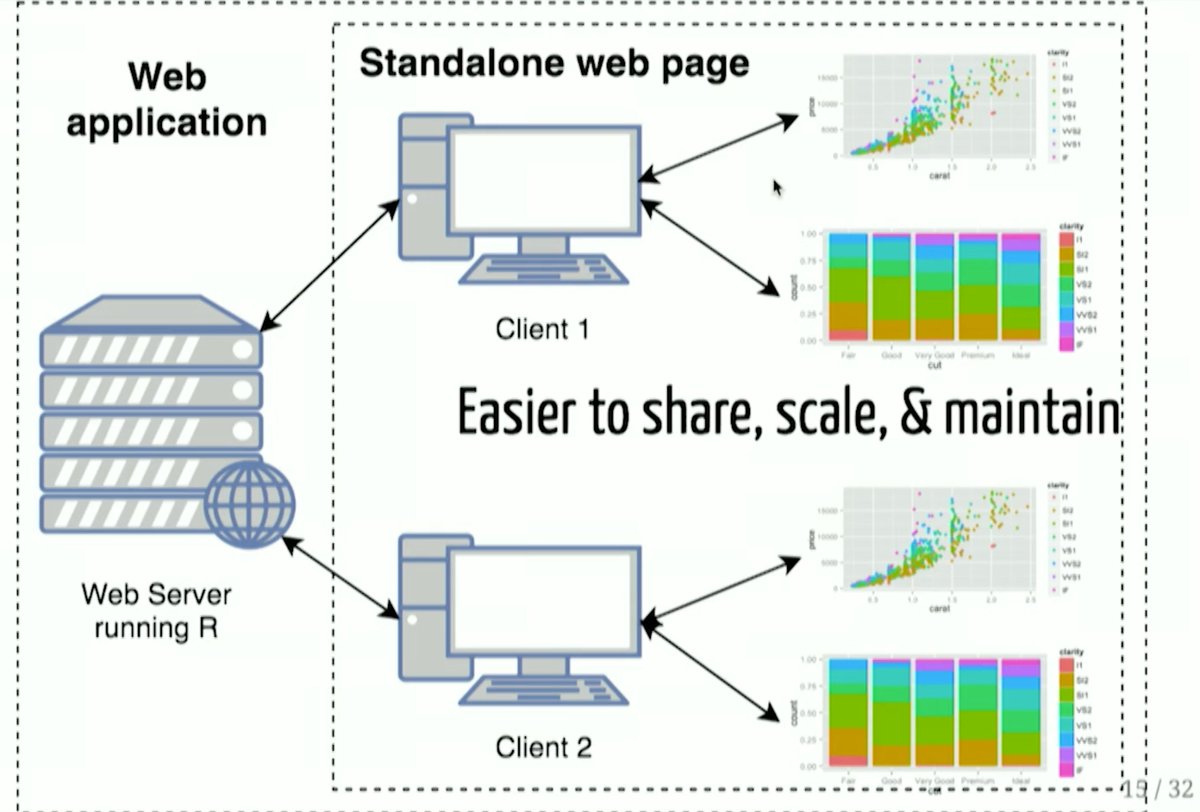
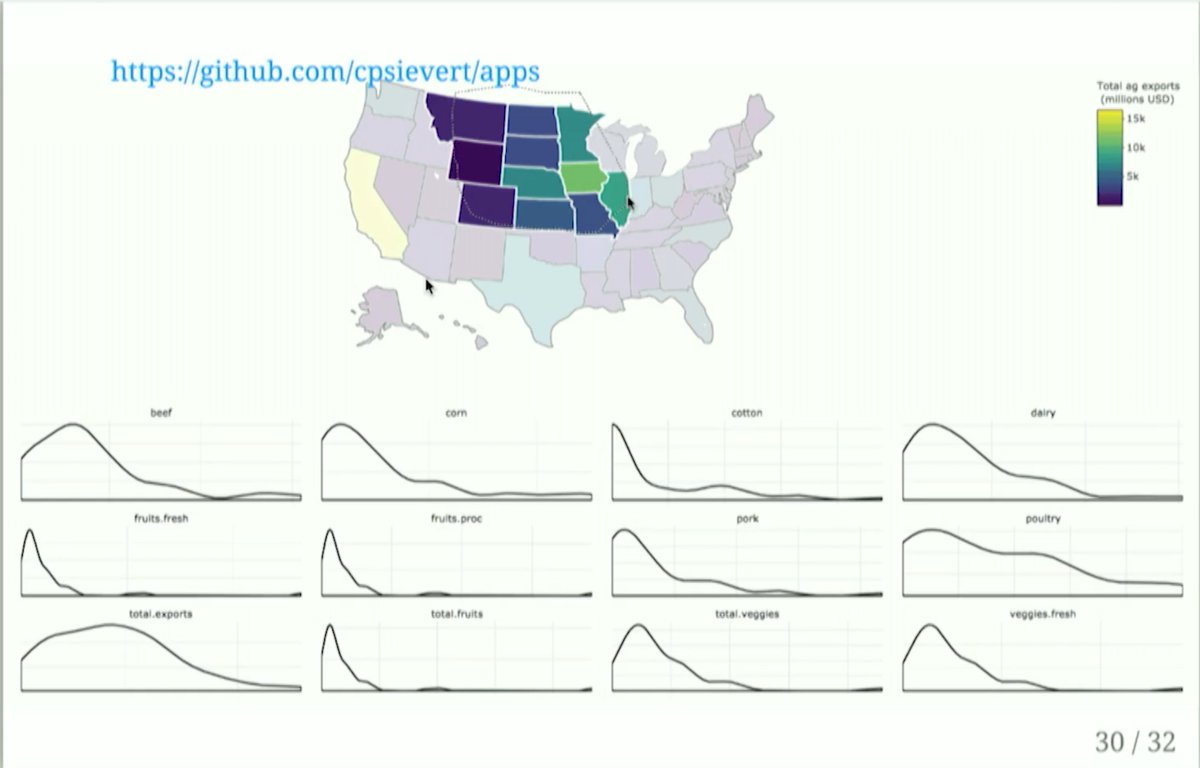
Preview of slides:
Reserve a seat:
⚽️ Introducing pitchly, a python package for visualizing football/soccer tracking and event data!
📊 pitchly works as a wrapper for #plotly under the hood & currently supports @MetricaSports data format.
⏯️ Give it a go!
📖 Docs:
We talk a lot about “the power of Dash”. That’s why we love seeing our #Plotly community put it to the test. 💪💙
Read Kay Jan Wong’s tips in @TDataScience to enhance initial skeleton code, advancing to professional #dashboard with #Python and #Dash.
Map design with #QGIS and #Plotly with variables for map colors, charts, titles and even SVG #storyset illustrations. Here’s the result! @qgis#Dataplotly