Posty z #GraphVisualization

#GraphVisualization

Publiczne posty w X, które używają #GraphVisualization.

Powiązane hashtagi

  1. Neo4j✓@neo4j
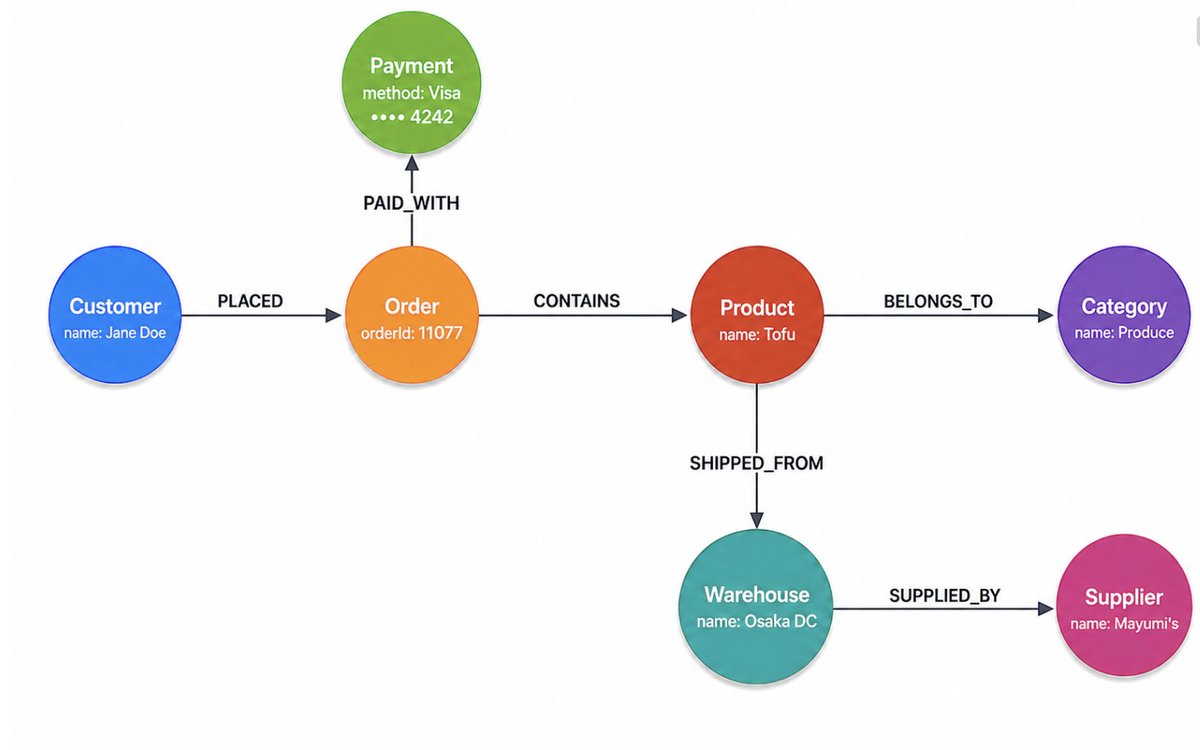
    If you don't know what a graph visualization is, stay here: 🌸 Neo4j Bloom 📋 Neo4j Dashboards 📚 Neo4j Visualization Library Take a deep dive into #GraphVisualization, how it helps your workflow, and how to use it. A blog to share and save :)
    Pobierz
    02111.6K
  2. yWorks@yworks
    yFiles for HTML 3.1.0.2 is live! 🚀 Explore our new Drag and Drop UI sample and check out the latest fixes based on user feedback. Demo: Changelog: #GraphVisualization #JavaScript #TypeScript
    00268
  3. Linkurious@Linkurious
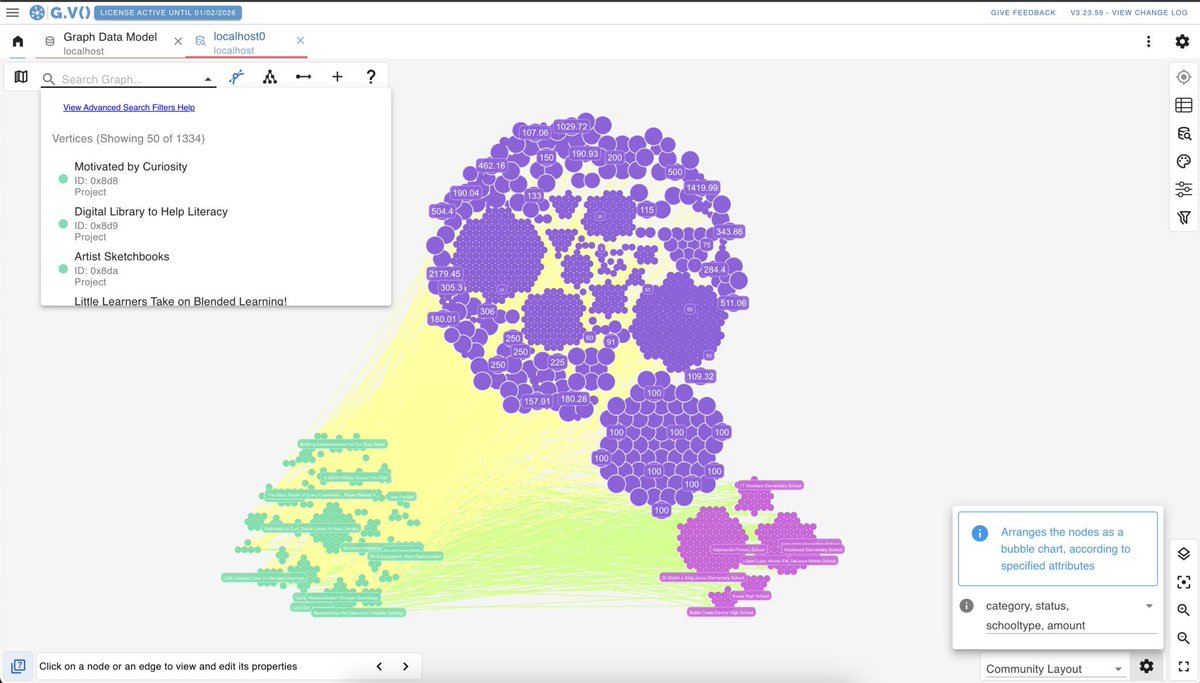
    Linkurious Enterprise now offers Node Grouping, a powerful feature to enhance visualization efficiency and clarity. 🔎 Discover how this new feature works and can be applied to various use cases: #GraphVisualization #DataAnalysis
    Pobierz
    022238
  4. yWorks@yworks
    Sneak peek. 👀 Join us on July 8 (5 PM CET) to see how AI can help build enterprise-grade graph visualizations. Zoom: LinkedIn: #AI #GraphVisualization
    Pobierz
    01385
  5. yWorks@yworks
    Big thanks to @neo4j for hosting us at #NODES2024! 🙌 Dr. Benjamin Niedermann shared insights on Advanced #GraphVisualization in #Jupyter Notebooks using #Neo4j & GDS for powerful data storytelling. 🔗 Notebook on Colab: 📺 Watch:
    006105
  6. yWorks@yworks
    Wishing everyone an amazing #KGC2026! 🎓✨ Counting down to Friday, May 8, where yWorks joins the Tools & Demo Track. Join to see the latest in #GraphVisualization and how to optimize your stack. Explore our Knowledge Graph Demo: 👉 #KnowledgeGraph
    00470
  7. Tom Sawyer Software@TSawyerSoftware
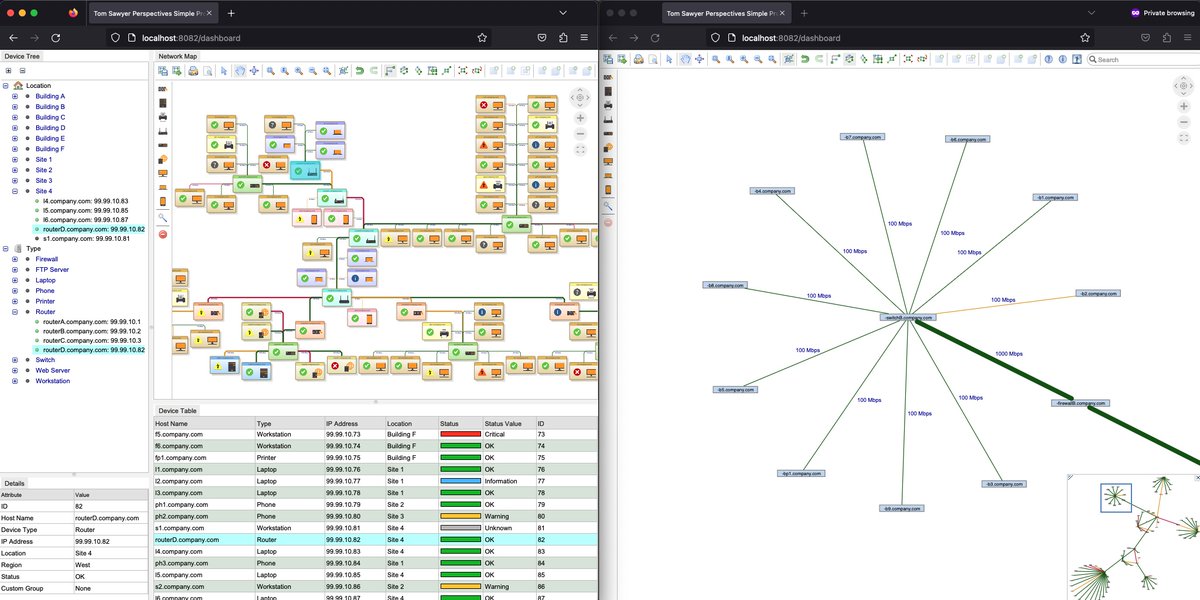
    Our newest blog discusses Javascript Graph Visualization. Learn how to build dynamic Javascript graph visualizations to explore data, from social networks to network topologies, with powerful tools and libraries. 📚 #javascript #graphvisualization #to...
    00250
  8. Oh-Hyun Kwon@OhHyunKwon
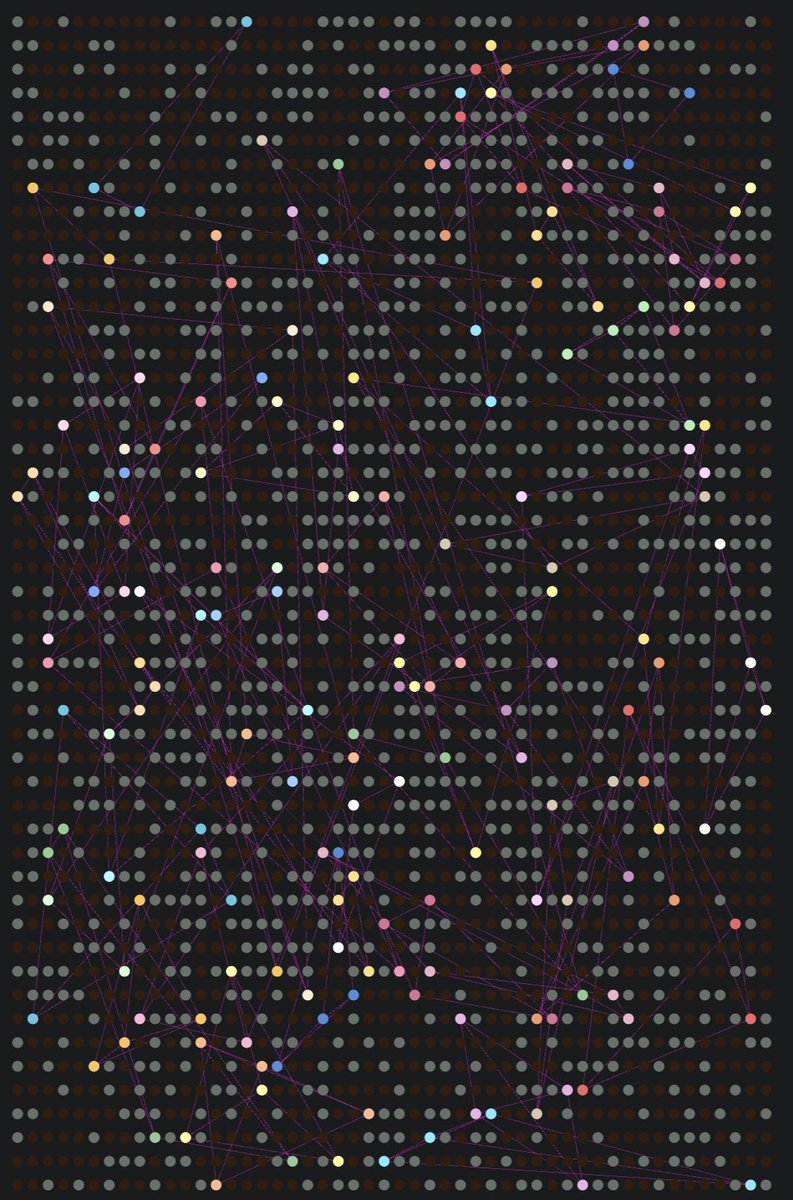
    Tired of blindly tweaking layout parameters to visualize your graph? Our #MachineLearning model builds a WYSIWYG interface for you to intuitively produce a layout you want! Check out our #IEEEVIS paper ( and demo ( #NetworkScience
    Pobierz
    185231.8K
  9. Linkurious@Linkurious
    As companies accumulate more data, using it effectively for informed #decisionmaking becomes increasingly challenging. Get to know how graph databases and #graphvisualization can transform the way organizations access and gain actionable insights:
    00291
  10. Pokaż więcej postów