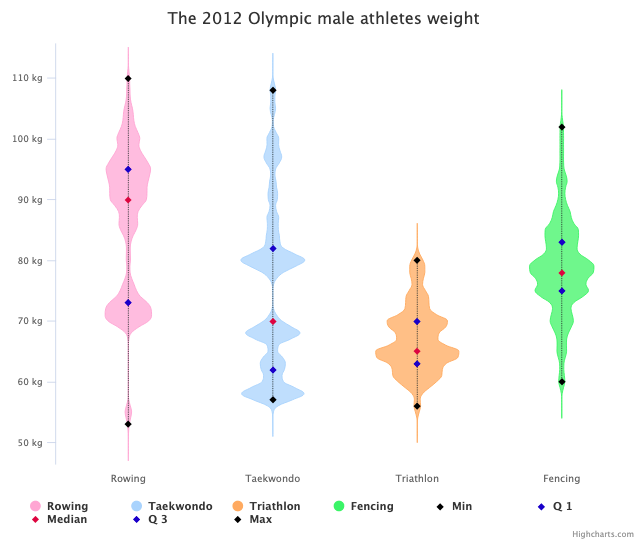
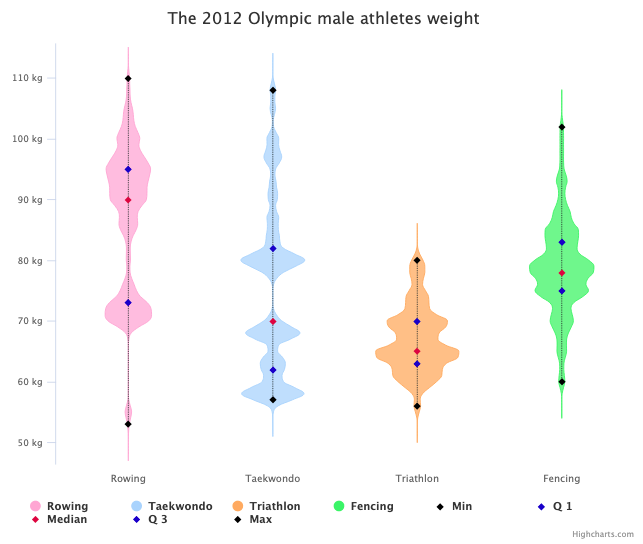
Highcharts✓@Highcharts·4yDIY violin plot with Highcharts for continuous data set. By @MusMekh Read more here: #violinplot #densityplot #dataviz #datascience #js #a11yİndirPaylaşKopyalandı03252.4K
Highcharts✓@Highcharts·6yIf you like violin charts or chart curves based on the Kernel Density Estimation, you will find the Density Chart very useful. Learn how to create one here: #dataviz #datascience #densityplot #KernelDensityEstimationİndirPaylaşKopyalandı122
Highcharts✓@Highcharts·6yIf you like violin charts or chart curves based on the Kernel Density Estimation, you will find the Density Chart very useful. Learn how to create one here: #dataviz #datascience #densityplot #KernelDensityEstimationİndirPaylaşKopyalandı002
Highcharts✓@Highcharts·6yIf you like violin charts or chart curves based on the Kernel Density Estimation, you will find the Density Chart very useful. Learn how to create one here: #dataviz #datascience #densityplot #KernelDensityEstimationİndirPaylaşKopyalandı021
Highcharts✓@Highcharts·6yIf you like violin charts or chart curves based on the Kernel Density Estimation, you will find the Density Chart very useful. Learn how to create one here: #dataviz #datascience #densityplot #KernelDensityEstimationİndirPaylaşKopyalandı001
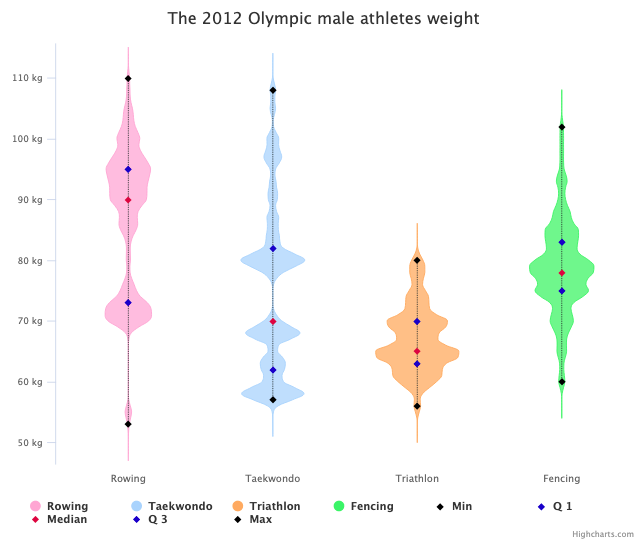
Highcharts✓@Highcharts·4yDIY violin plot with Highcharts for continuous data set. By @MusMekh Read more here: #violinplot #densityplot #dataviz #datascience #js #a11yİndirPaylaşKopyalandı004232
Highcharts✓@Highcharts·6yViolin plot with Highcharts using streamgraph. Read more here: #violinplot #densityplot #streamgraph #dataviz #datascience #jsİndirPaylaşKopyalandı002
Highcharts✓@Highcharts·5yIf you like violin charts or chart curves based on the Kernel Density Estimation, you will find the Density Chart very useful. Learn how to create one here: #dataviz #datascience #densityplot #KernelDensityEstimationİndirPaylaşKopyalandı002
Highcharts✓@Highcharts·4yDIY violin plot with Highcharts for continuous data set. By @MusMekh Read more here: #violinplot #densityplot #dataviz #datascience #jsİndirPaylaşKopyalandı001
Highcharts✓@Highcharts·5yDIY violin plot with Highcharts for continuous data set. #violinplot #densityplot #dataviz #datascience #jsİndirPaylaşKopyalandı002
ZingChart@ZingChart·7yCombine a #BoxPlot and a #DensityPlot and what do you get? One of our newest chart types - a #ViolinChart! 🎻 Check out this demo to add this chart type to your toolkit 👉🏽 #javascript #ZingChart #dataviz #DatavisualizationİndirPaylaşKopyalandı022
Highcharts✓@Highcharts·6yIf you like violin charts or chart curves based on the Kernel Density Estimation, you will find the Density Chart very useful. Learn how to create one here: #dataviz #datascience #densityplot #KernelDensityEstimationİndirPaylaşKopyalandı024
Highcharts✓@Highcharts·6yDIY violin plot with Highcharts for continuous data set. #violinplot #densityplot #dataviz #datascience #jsİndirPaylaşKopyalandı003
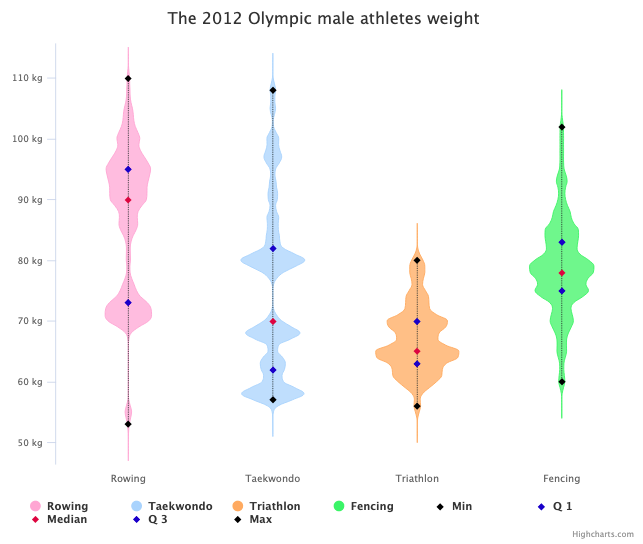
Highcharts✓@Highcharts·3yDIY violin plot with Highcharts for continuous data set. By @MusMekh Read more here: #violinplot #densityplot #dataviz #datascience #js #a11yİndirPaylaşKopyalandı002224
Highcharts✓@Highcharts·6yDIY violin plot with Highcharts for continuous data set. #violinplot #densityplot #dataviz #datascience #jsİndirPaylaşKopyalandı003
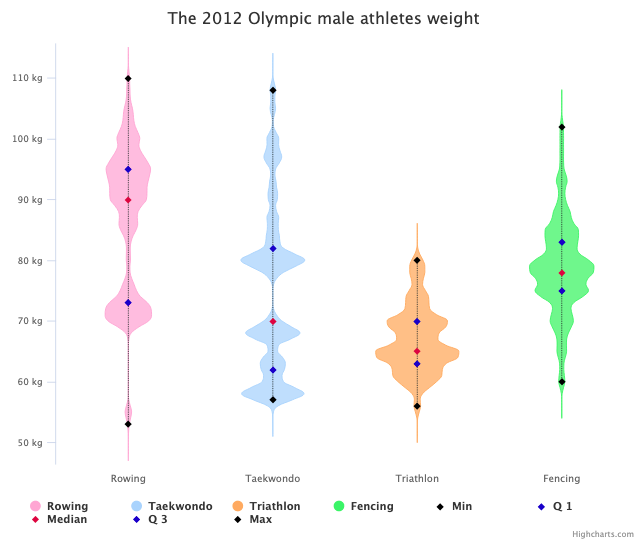
Highcharts✓@Highcharts·4yDIY violin plot with Highcharts for continuous data set. By @MusMekh Read more here: #violinplot #densityplot #dataviz #datascience #jsİndirPaylaşKopyalandı001
Highcharts✓@Highcharts·6yIf you like violin charts or chart curves based on the Kernel Density Estimation, you will find the Density Chart very useful. Learn how to create one here: #dataviz #datascience #densityplot #KernelDensityEstimationİndirPaylaşKopyalandı001
Highcharts✓@Highcharts·6yIf you like violin charts or chart curves based on the Kernel Density Estimation, you will find the Density Chart very useful. Learn how to create one here: #dataviz #datascience #densityplot #KernelDensityEstimationİndirPaylaşKopyalandı001
Highcharts✓@Highcharts·5yDIY violin plot with Highcharts for continuous data set. By @MusMekh Read more here: #violinplot #densityplot #dataviz #DataScience #DataScientist #jsİndirPaylaşKopyalandı022
Dagmar Divjak@dagmardivjak·6yWhen it's Friday afternoon and you're trying to tame eye-tracking variables for statistical modelling ... @petarmilin #density #histogramİndirPaylaşKopyalandı218
ℙ𝕖𝕥𝕒𝕣 𝕄𝕚𝕝𝕚𝕟@petarmilin·6y@dagmardivjak@dagmardivjak That's actually the contour of my hair after doing #densityplot instead of #histogram 🙃PaylaşKopyalandı003