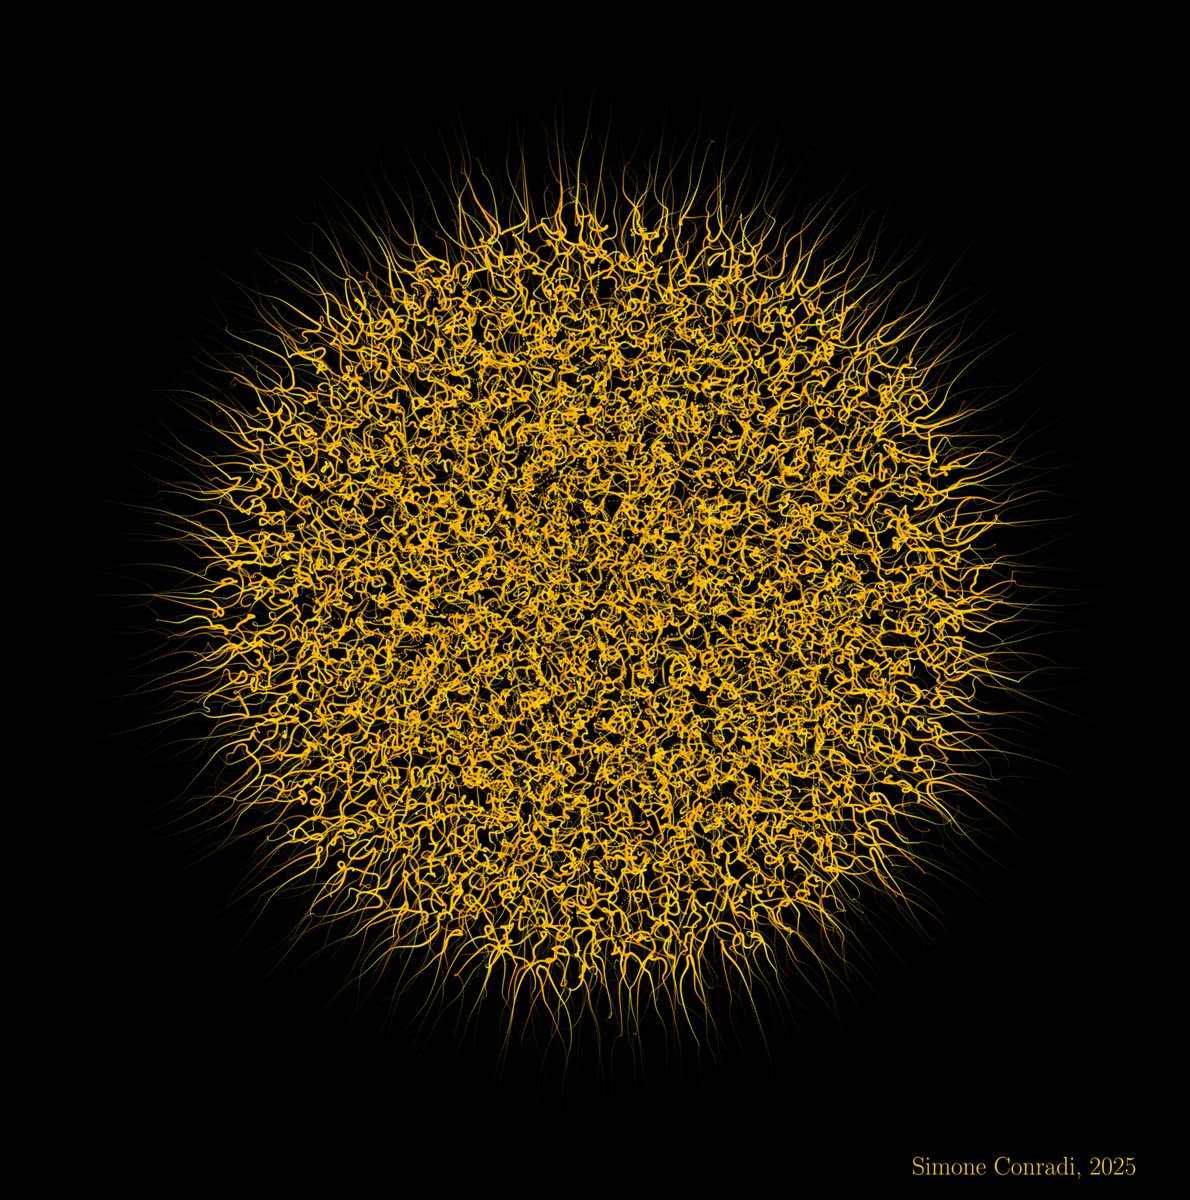
Take two large random matrices and linearly interpolate between them at several hundred steps. Compute the eigenvalues for each interpolated matrix, then plot them in the complex plane. The result is shown here.
Made with #python#numpy#matplotlib
Each blob is an eigenvalue. At every frame, I apply small random perturbations and compute eigenvalues each time, this builds the blobs. A real parameter t drives the animation. Thanks to @reidatcheson for making me think about pseudospectra.
Made with #python#numpy#matplotlib
Day 9 of my AI/ML & Data Science Journey!
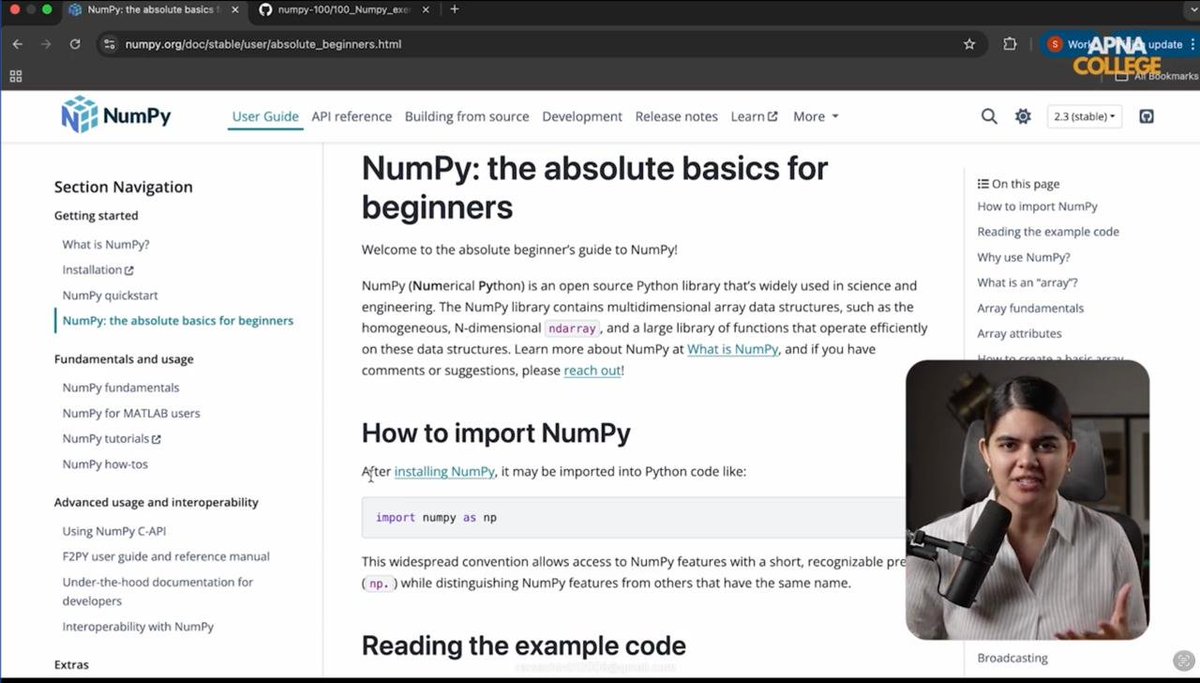
Learning NumPy — the foundation for numerical computing.
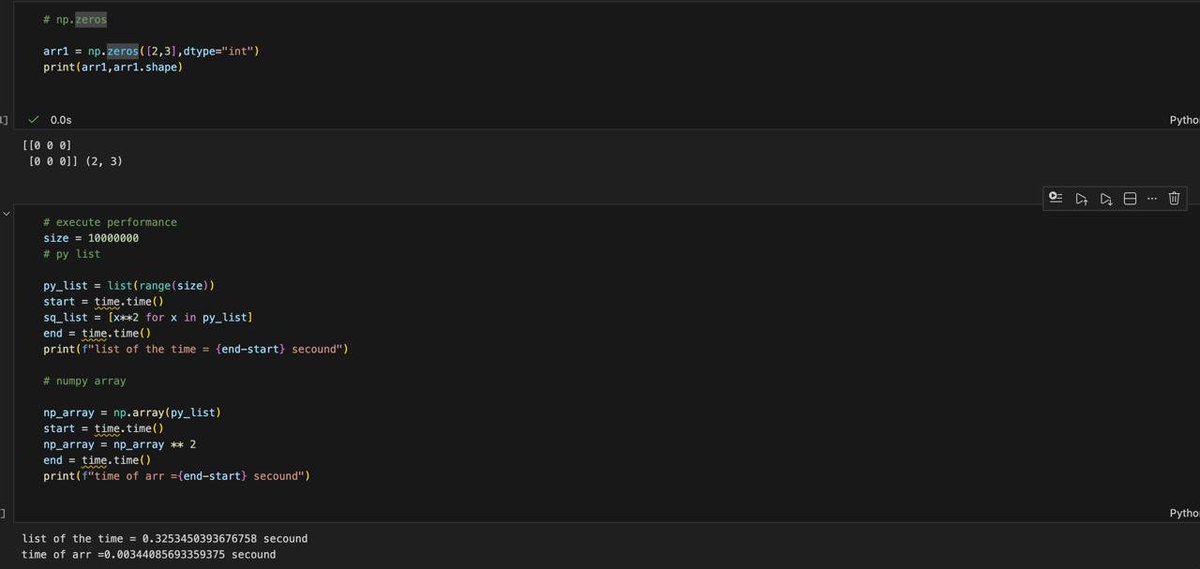
• Arrays vs Python lists
• Creating & reshaping arrays
• Indexing & slicing
Building strong fundamentals one step at a time.
#Python#NumPy#DataScience#MachineLearning
First energy levels of a 2D quantum harmonic oscillator. Each pattern shows where you're most likely to find the particle.
Made with #Python#NumPy#Matplotlib on the train coming back from @pyconit#PyConIT2025
A simulation of the dielectric breakdown model described in Fractal Dimension of Dielectric Breakdown
L. Niemeyer, L. Pietronero, and H. J. Wiesmann
Phys. Rev. Lett. 52, 1033 – Published 19 March 1984
Made with #python, #numpy and #matplotlib.