Each blob is an eigenvalue. At every frame, I apply small random perturbations and compute eigenvalues each time, this builds the blobs. A real parameter t drives the animation. Thanks to @reidatcheson for making me think about pseudospectra.
Made with #python#numpy#matplotlib
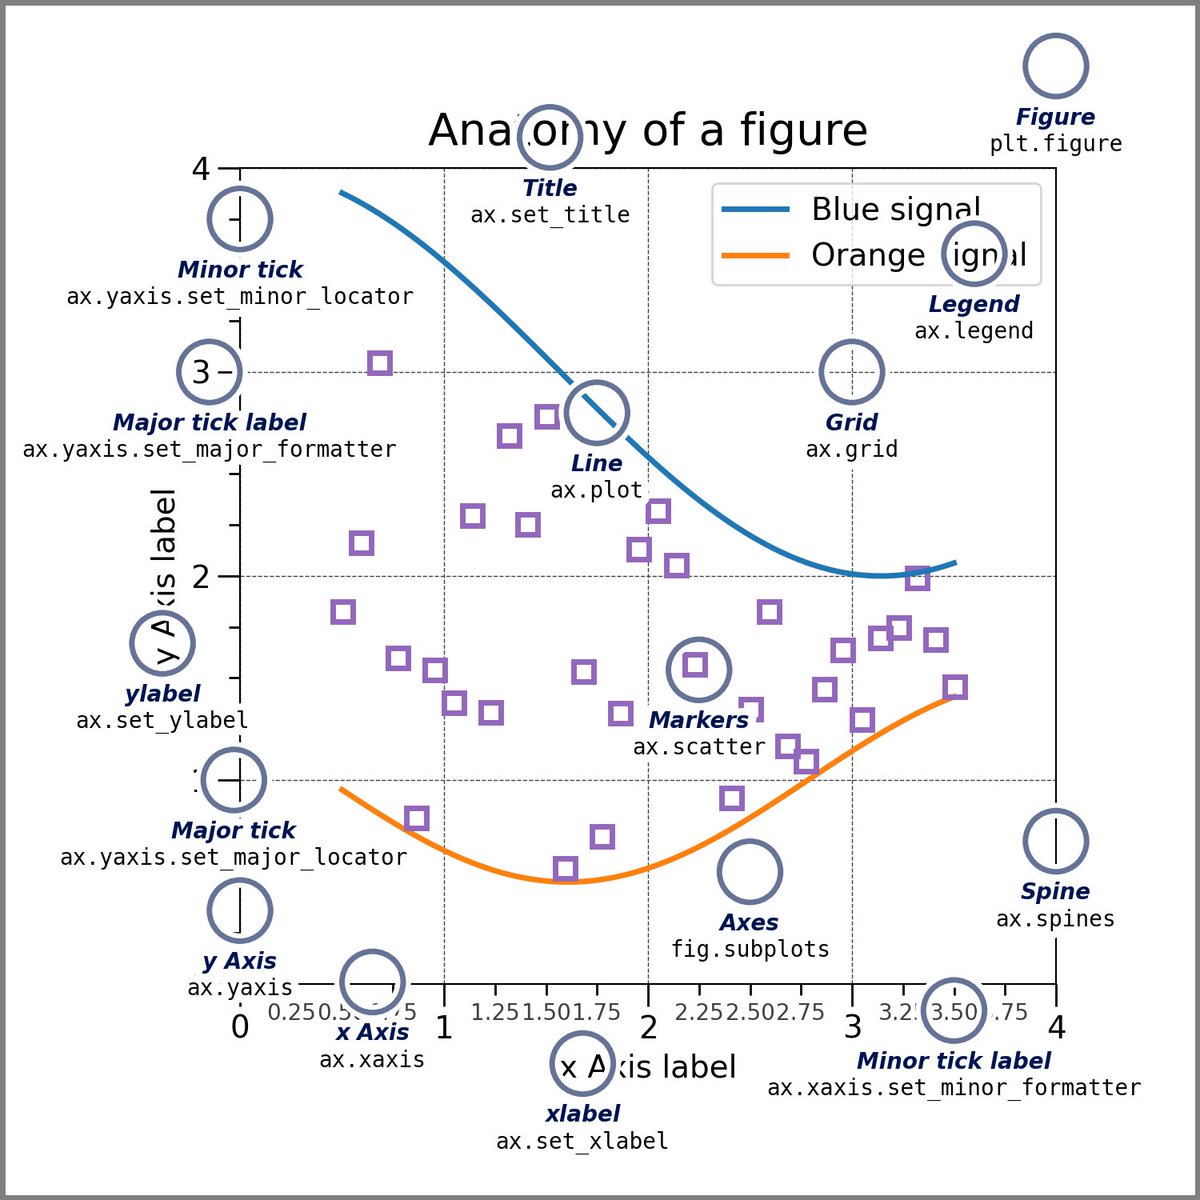
#Matplotlib is not just for displaying data…
…here I use it for a fun simulation of planets orbiting a sun (or many suns, see next tweet)
Here's the article if you're looking for a step-by-step tutorial:
#python#planets@matplotlib
#BackPy siempre mejor. 🎃
Ver gráficas con #matplotlib en #Python cada vez es más temático.
Podrán instalar esta versión de #BackPy 1.0.20 a partir de mañana en la rama wip/main (rama de desarrollo), por si quieren replicarla en su PC. 🕯️
#Halloween#Trading#Crypto
Genuary day 4: Lowres. An image or graphic with low resolution.
Take a Hilbert curve matching your image resolution. Now push the image along the curve. Watch till the end.
Made with #python#numpy#matplotlib#genuary#genuary4#genuary2026
Want an easy way to plot multilayer networks using #matplotlib and #networkx? I'm sure there's tons of ways to do this, but here's my attempt at a template.
Shoutout to @ryanjgallag for the motivation.
A simulation of the dielectric breakdown model described in Fractal Dimension of Dielectric Breakdown
L. Niemeyer, L. Pietronero, and H. J. Wiesmann
Phys. Rev. Lett. 52, 1033 – Published 19 March 1984
Made with #python, #numpy and #matplotlib.
From mazes to bacteria like structures, the Gray-Scott reaction-diffusion model reveals how small tweaks to diffusion rates (Du, Dv) and reaction parameters (F, k) produce different emergent morphologies. Mathematical beauty in action!
Made with #python#matplotlib#mlx