Post con #raincloudplot

#raincloudplot

Post pubblici su X che usano #raincloudplot.

Hashtag correlati

  1. ThinkR@thinkR_fr
    "Friends don't let friends make #barbarplots", they suggest #raincloudplot. A colourful illustration of why we should get rid of barplot to plot counts by @CedScherer
    Scarica
    Cédric Scherer @CedScherer
    Visualizing Uncertainty and Chart Choice 📊⁉️ For the upcoming workshop about #DataViz in #science I've created my own version of how important it is to show raw data #rstats #ggplot2 Inspired by Weissgerber et al. 2015 ( and @R_Graph_Gallery
    11451
  2. Ben Krajacich@bkraj
    Our new pre-print is out on our efforts to induce aestivation (summer diapause, a dry season persistence mechanism), in laboratory Anopheles spp. mosquitoes. With @faimanr, @coolicidae, @tovilehmann
    bioRxiv Ecology @biorxiv_ecology
    Induction of long-lived potential aestivation states in laboratory An. gambiae mosquitoes #biorxiv_ecology
    2412
  3. bioRxiv Ecology@biorxiv_ecology
    Induction of long-lived potential aestivation states in laboratory An. gambiae mosquitoes #biorxiv_ecology
    014
  4. Ben Krajacich@bkraj
    @bkraj
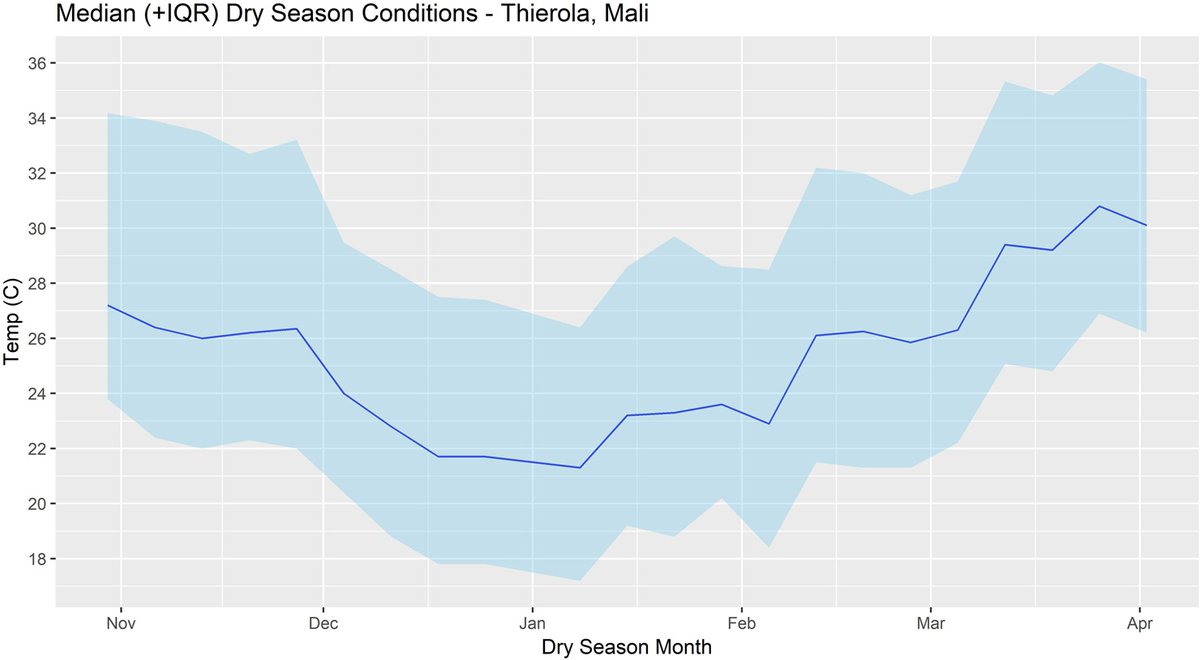
    Borrowing from diapause literature in other Culicidae, we attempted to prime mosquitoes for aestivation using end of wet season conditions before moving them into potential early dry season refugia microclimate conditions (cool, dark, and humid).
    Scarica
    101
  5. Ben Krajacich@bkraj
    @bkraj
    This combination greatly extended lifespans with maximum longevities up to 109 days. Counter to expectations, both An. coluzzii (M-form) and An. gambiae s.s. (S-form) mosquitoes had these extension effects. #rstats #raincloudplot
    Scarica
    112
  6. Oh Lab at UC Berkeley🔍🧩🤼‍♂️👁‍🗨@ohlab_ucb
    In press #JEPGeneral: Gender Biases in Impressions from Faces👩👨🔍 We found: (1) women are judged negatively to the extent their looks don't conform to expectations. (2) this is because facial info is evaluated differently across genders (not bc diff info is used btw genders).
    21125
  7. Micah G. Allen✓@micahgallen
    #OpenScience is not only the right way to science, it's the most fun. The #raincloudplot project has taught me so much about good coding, python, r, Markdown, and open collaboration. Every little bit you put out there, the community gives back in spades. #StrongerTogether
    1320
  8. Kirstie Whitaker@kirstie_j
    Or a combo of a scatter graph and a violin plot: a #RainCloudPlot!! Preprint: Code (Python, R, Matlab):
    Antoine van Oijen 🔬🧫🧬 @van__Oijen
    It's time to stop using box plots in the scientific literature. Shapes of data distributions hiding underneath a box plot are important, so show them! Better alternatives are scatter graphs or violin plots. Great explanation at
    0720
  9. Antoine van Oijen 🔬🧫🧬@van__Oijen
    It's time to stop using box plots in the scientific literature. Shapes of data distributions hiding underneath a box plot are important, so show them! Better alternatives are scatter graphs or violin plots. Great explanation at
    Scarica
    13358885
  10. Mostra altri post