Posts with #boxplot

#boxplot

Public posts on X that use #boxplot.

Related hashtags

  1. Mustafa Çavuş@mustafa__cavus
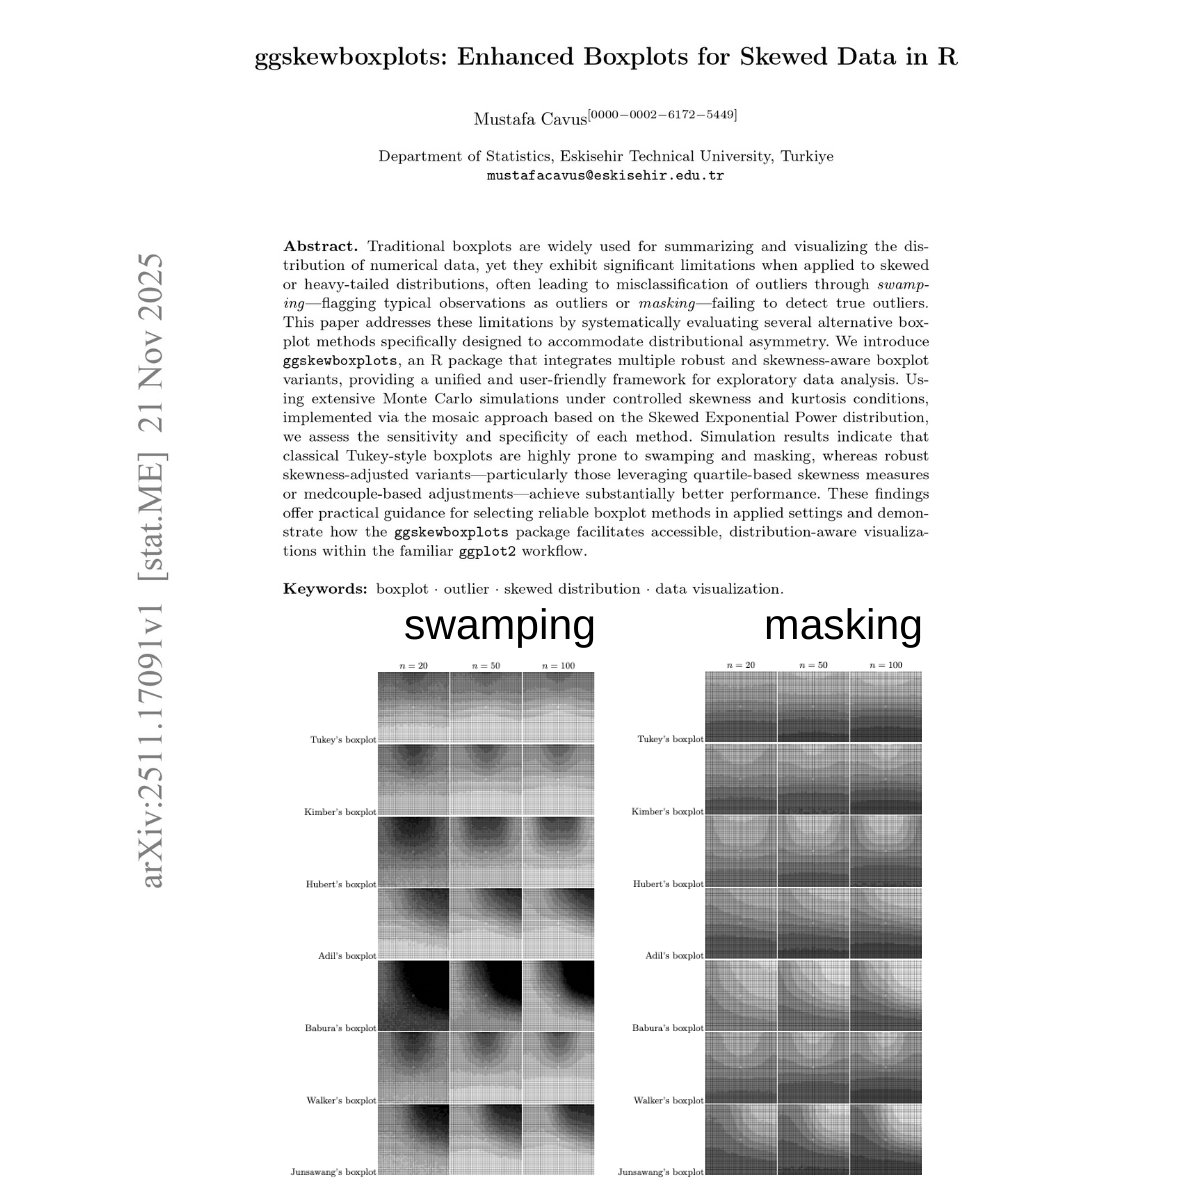
    Still using #boxplot for #outlier detection without considering data distribution? Tukey boxplot can mislead when data is skewed: Swamping → normal points flagged as outliers Masking → real outliers hidden I created an R package for solving this problem! Let's check it out 👇
    Download
    005218
  2. Dr. Vahid Aryadoust@VahidAryadoust
    I have just released a video on using RStudio to demonstrate generating boxplots with ggplot library. The link is as follows: To access the codes (scripts), check the GitHub link in the description section of the video. #rstudio #ggplot2 #boxplot
    007
  3. Joachim Goedhart@joachimgoedhart
    Confidence intervals should be corrected for small n, using the t-statistic. Note that 'notches' of boxplots (reflecting 95% CI of the median) are NOT corrected for small n (n<20) #ggplot2 #boxplot
    015
  4. PhET Sims@PhETsims
    The Center and Variability simulation allows students to explore mean, median, range, Interquartile Range, and measures of spread by interacting with different kickers’ unique data distributions from kicks. #boxPlot #distributions
    Download
    1413644
  5. Subhadip Nandy✓@SubhadipNandy16
    @SubhadipNandy16
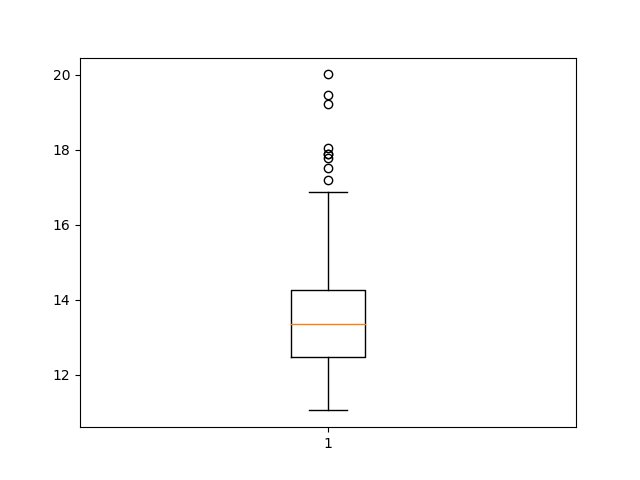
    3. The lowest quartile 12.5 and below. Sellers will be at a disadvantage in initiating their strategies here. This is options buy strategies market 4. The topmost quartile 14.5-17 is where one can initiate selling strategies, buying strategies obviously will be at a disadvantage
    Download
    2666
  6. Subhadip Nandy✓@SubhadipNandy16
    @SubhadipNandy16
    This explanation will vary in individual stocks ( different IV regime), but we will get statistically valid zones to determine what kind of strategies should we deploy. Infinitely more rpeferable than flying blind. And the #BoxPlot solves the IV spike problem (15/n)
    2552
  7. Subhadip Nandy✓@SubhadipNandy16
    @SubhadipNandy16
    In descriptive statistics, a #BoxPlot is a method for graphically depicting groups of numerical data through their quartiles. #BoxPlot may also have lines extending vertically from the boxes (whiskers) indicating variability outside the upper and lower quartiles,
    1443
  8. ir. Wouter de Heij✓@deheij
    Even geen #stikstof vandaag, ik heb andere werkzaamheden te doen. Uit interesse zit ik wat te kijken naar LCA data van een paar honderd producten. Twee vragen: Wie kent er openbare #LCA databases? Hier voor de verschillende categorieën de LCA data in een #boxplot. Wie kent er een openbare consumptie database? Kortom, wat eten we per persoon per jaar? #dtv
    Download
    6371.3K
  9. Show more posts