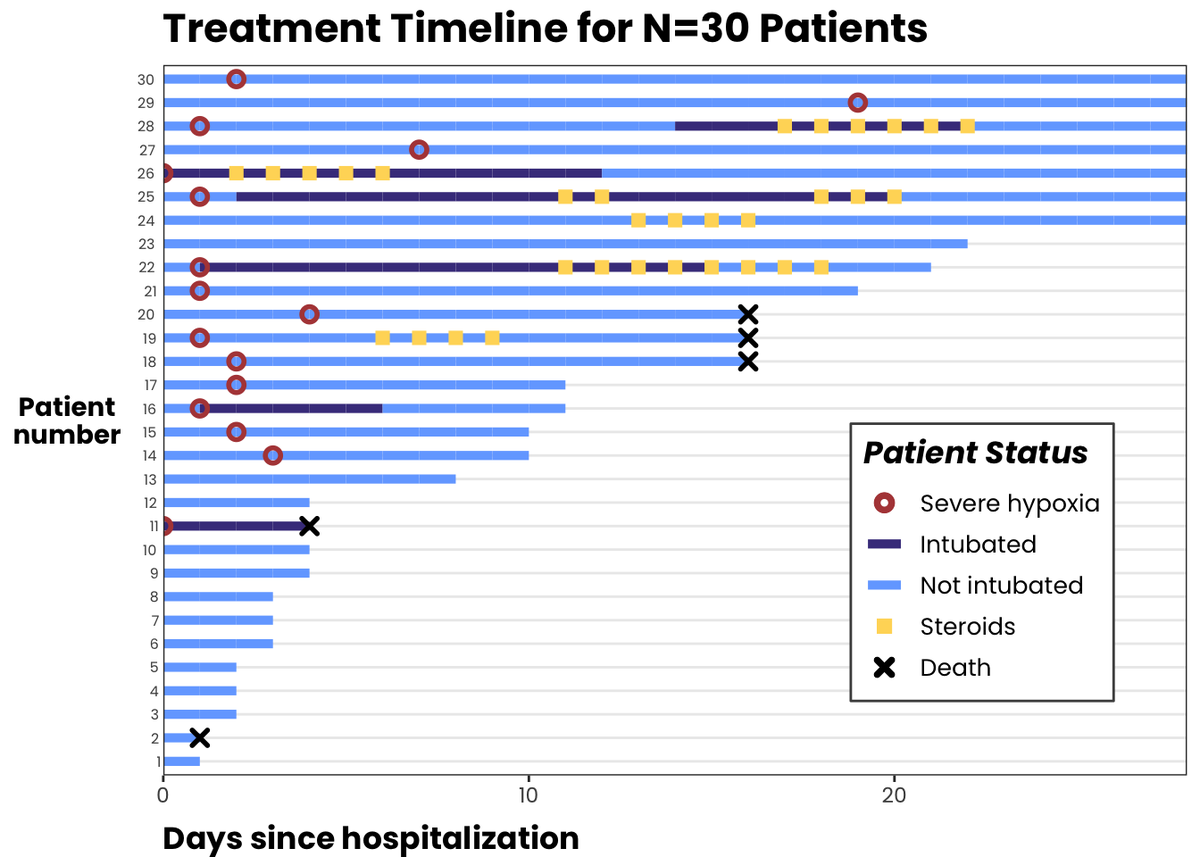
📣 new blog post! a step-by-step guide to making individual timelines or "swimmer plots" with multiple variables in R
🏊♀️➡️ #rstats#ggplot2#datascience
I am beyond excited to announce that ggplot2 4.0.0 has just landed on CRAN.
It's not every day we have a new major hashtag #ggplot2 release but it is a fitting 18 year birthday present for the package.
Get an overview of the release here:
I am thrilled to announce that #ggplot2 v3.3.0 has landed on CRAN. This release is filled to the brim with new features that you can read more about here #rstats
I've created an interactive app that generates a dashboard of visualizations that can be useful in getting an overview of a football player's finishing ability.
#RStats#rshiny#ggplot2
Didn't know there are at least 5 different ways to change the axis title in #ggplot2.I just started creating a new cheat sheet that shows how to change axis elements in ggplot2 in different ways. Anything I am missing still? #rstats
I'm a total newbie to #R and #ggplot2 but I'm slowly getting the hang of it! I've collated some resources I've found useful and may help others to get started. I would also love to hear if anyone has any other recommendations... 1/6
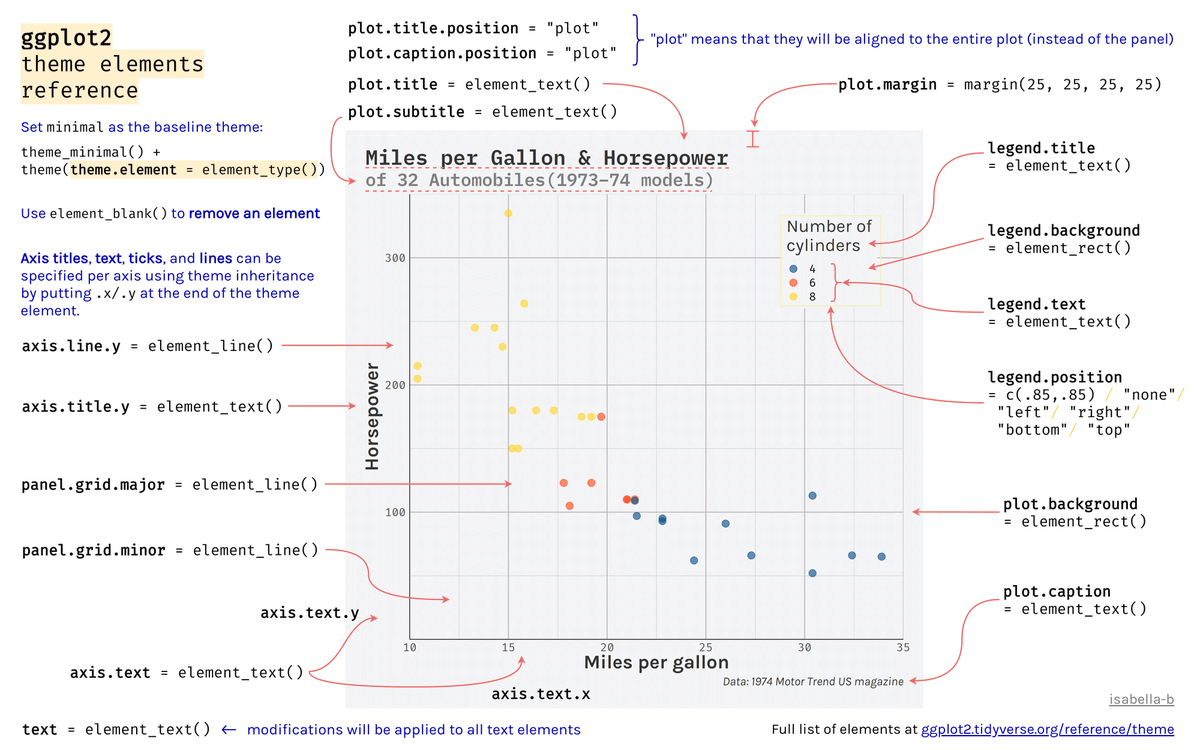
It seems many of you have found this Theme Elements in #ggplot2 in #rstats cheatsheet useful but lost track of the link to the original hi-res version. Here it is ➡️
Any #rspatial and #biologging folks out there interested in how I process and work with bearded seal telemetry and movement data?? Check out this new vignette: ... thanks to devs who work on the #ggplot2#sf#mapview#gganimate and #tidyverse packages
Quien sepa programar en R y le interese aprender cómo hacer este tipo de gráficos ⬇️, les dejo link a un repo de Github donde explico cómo los hago yo.
Link: #rstats#ggplot2
Happened across a DEM of earth for the past 540 million years and couldn't resist #gganimate-ing it! Best part is watching India absolutely wreck Asia ~25 Ma. Data here: Code here: #rstats#ggplot2#paleogeography