Mustafa Çavuş@mustafa__cavus
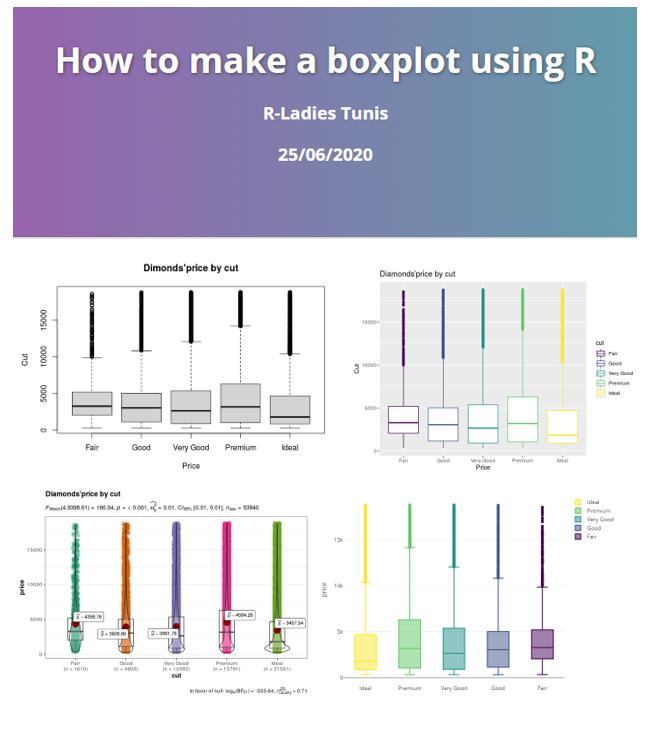
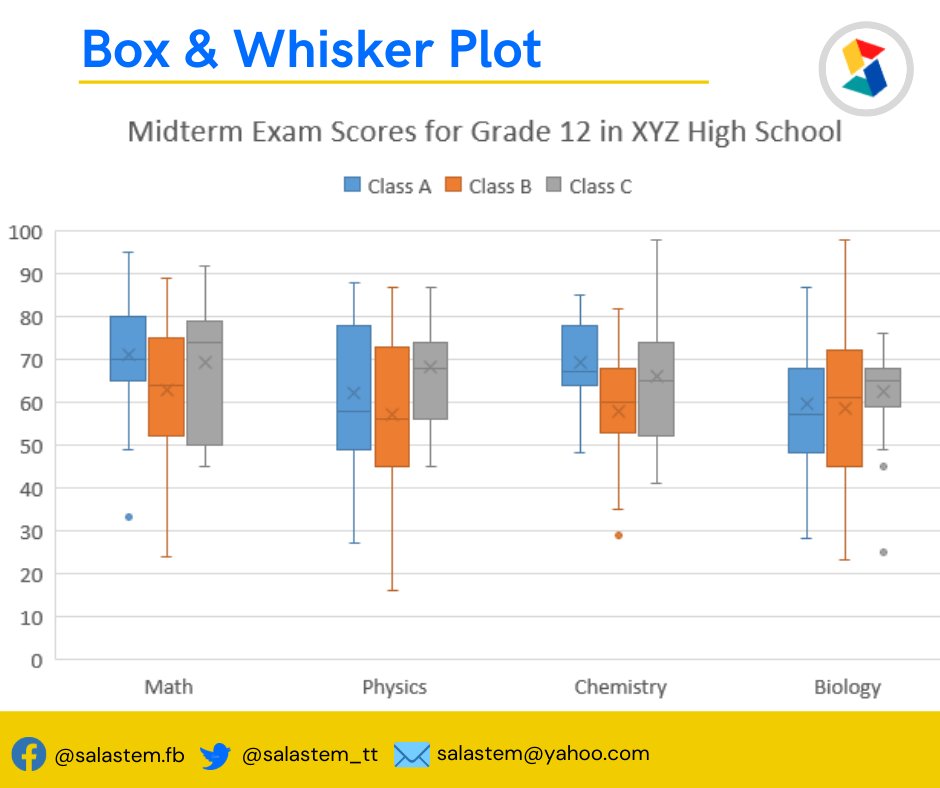
Still using #boxplot for #outlier detection without considering data distribution?
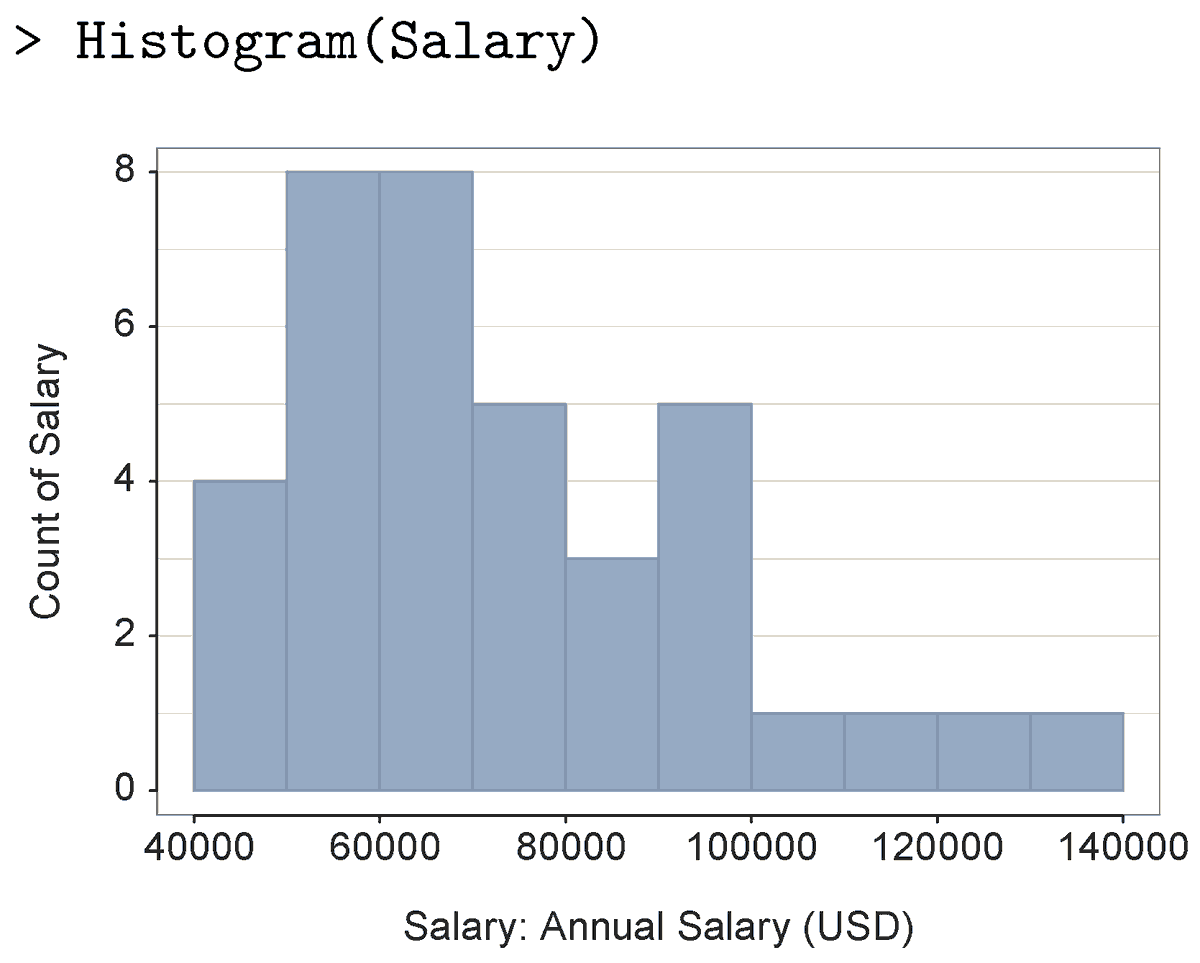
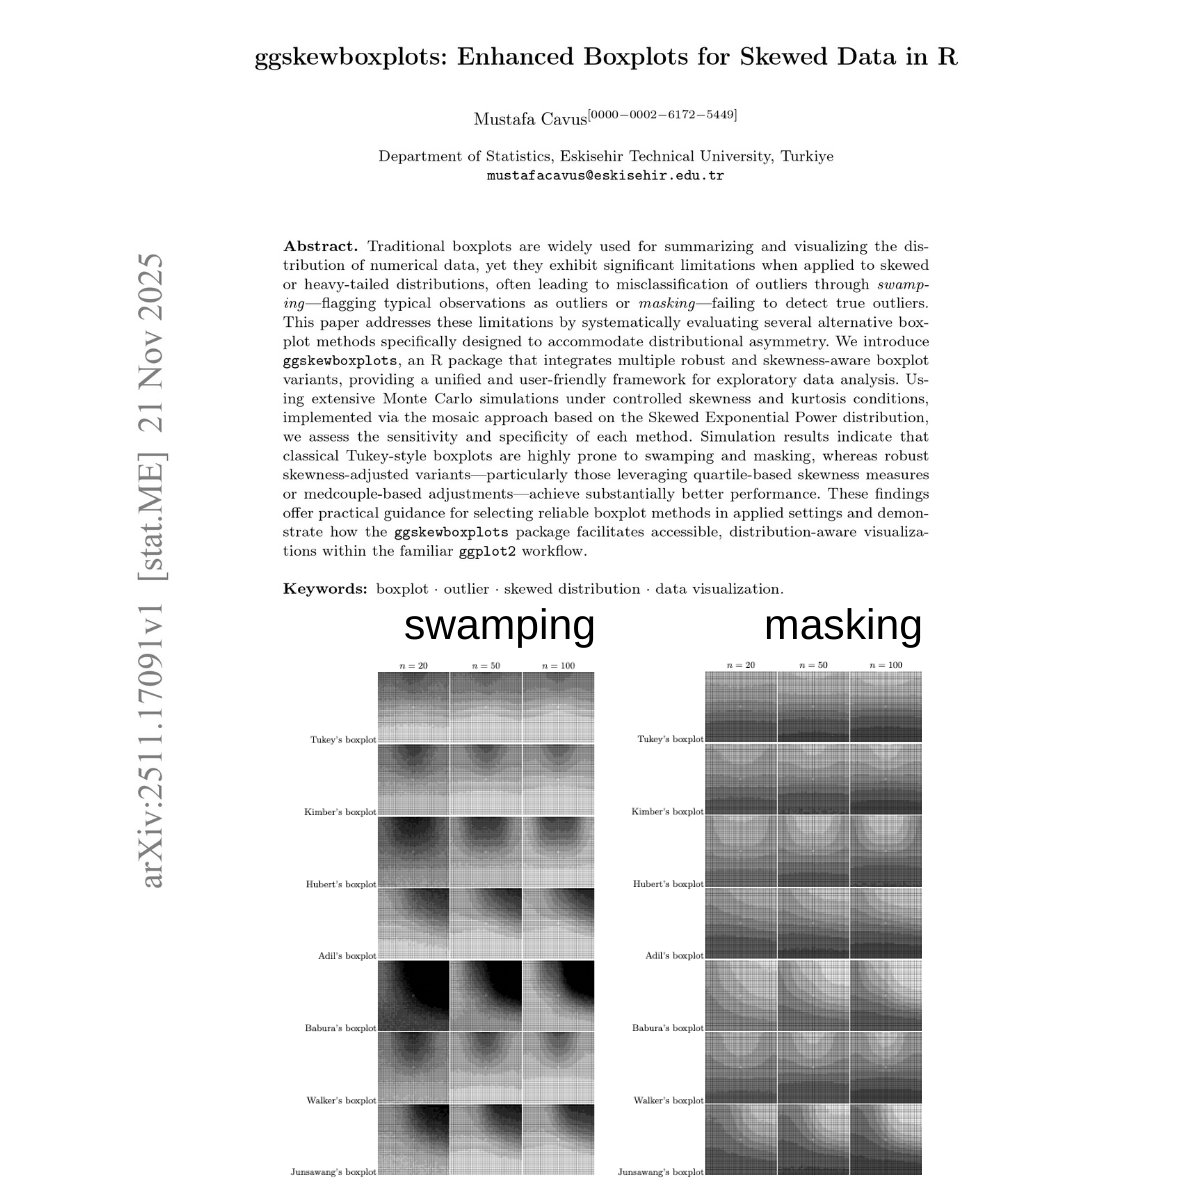
Tukey boxplot can mislead when data is skewed:
Swamping → normal points flagged as outliers
Masking → real outliers hidden
I created an R package for solving this problem!
Let's check it out 👇
005218