Posts with #boxPlot

#boxPlot

Public posts on X that use #boxPlot.

Related hashtags

  1. Mustafa Çavuş@mustafa__cavus
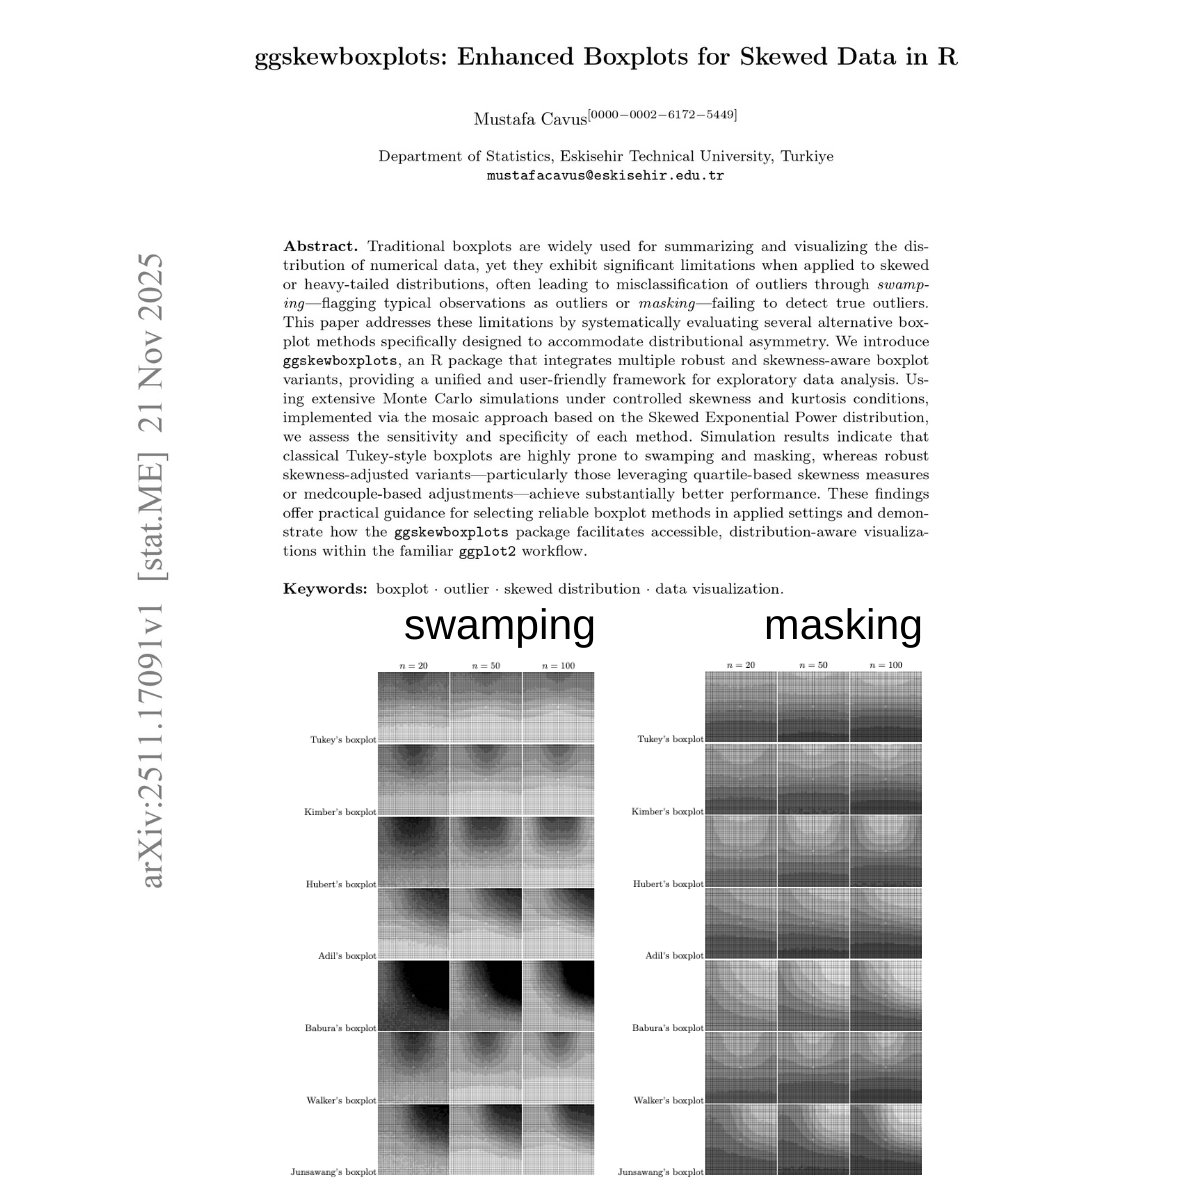
    Still using #boxplot for #outlier detection without considering data distribution? Tukey boxplot can mislead when data is skewed: Swamping → normal points flagged as outliers Masking → real outliers hidden I created an R package for solving this problem! Let's check it out 👇
    Download
    005218
  2. PhET Sims@PhETsims
    The Center and Variability simulation allows students to explore mean, median, range, Interquartile Range, and measures of spread by interacting with different kickers’ unique data distributions from kicks. #boxPlot #distributions
    Download
    1413644
  3. The Double A@aadityaseal
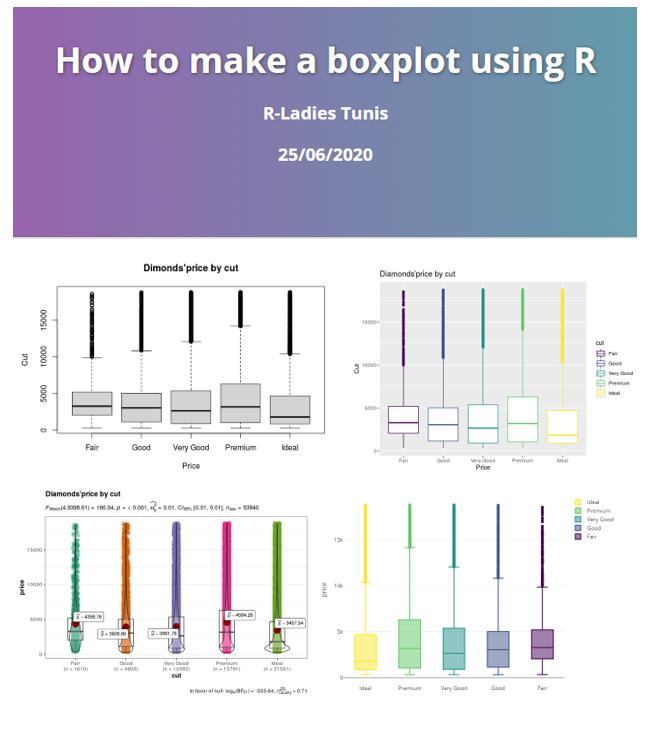
    Just go through this one and see how useful #boxplot can be for #Data professionals. This will help, believe me! #DataScience #Statistics #MachineLearning #deeplearning #Python
    Matt Dancho (Business Science) @mdancho84
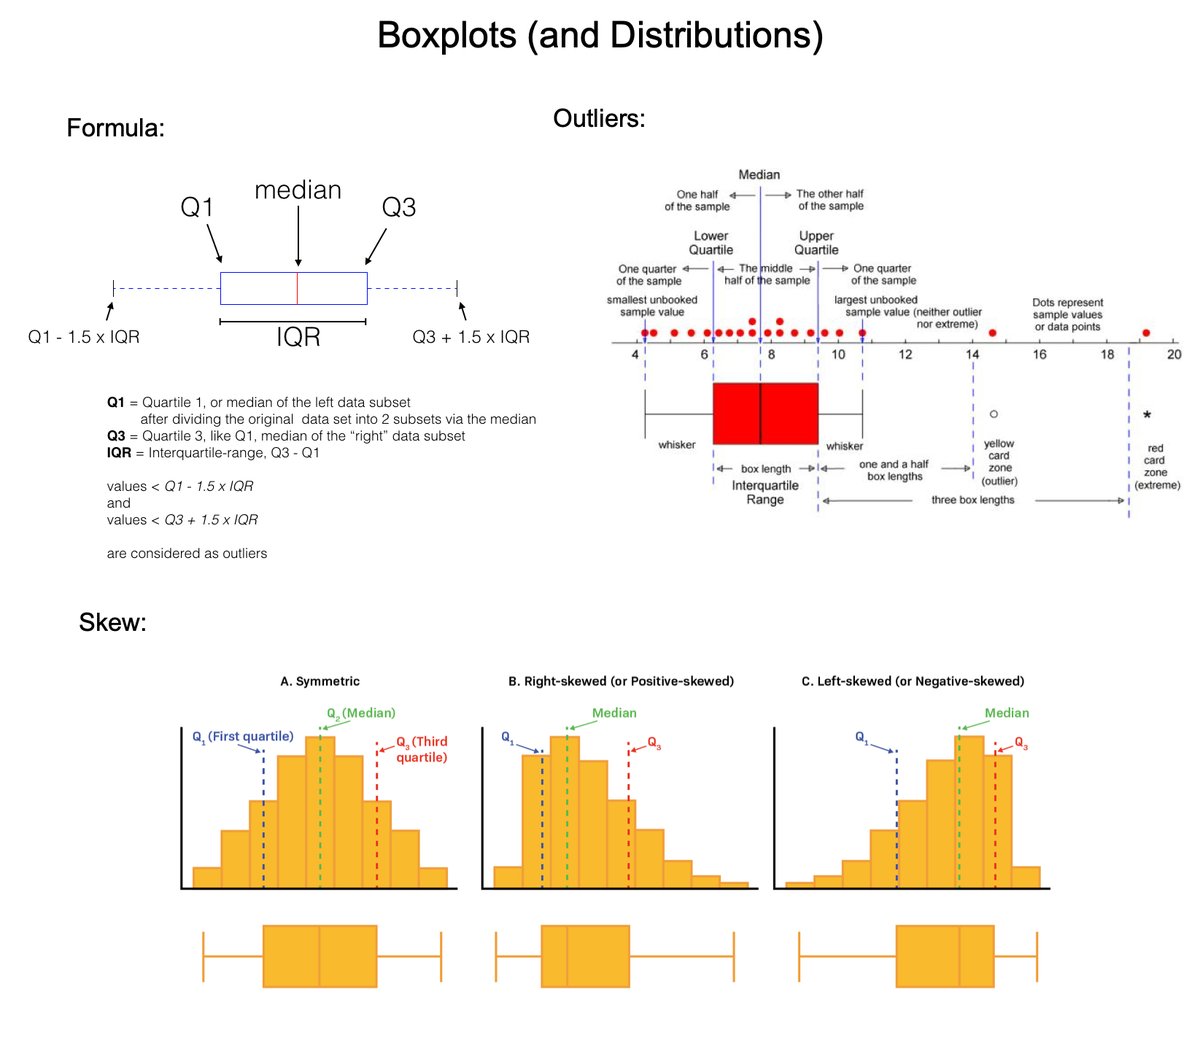
    Boxplots are one of the most useful tools in my Data Science arsenal. In 6 minutes, I'll teach you 6 years of using box plots for EDA and problem-solving. Let's dive in. 1. What is a boxplot? A boxplot is a standardized way of displaying the distribution of data based on a five-number summary: minimum, first quartile (Q1), median, third quartile (Q3), and maximum. 2. Invention: The boxplot was invented in 1969 by John Tukey, as part of his pioneering work in data visualization. Tukey's EDA emphasized the importance of using simple graphical and numerical methods to start understanding the data before making any assumptions about its underlying distribution or applying complex statistical models. The boxplot emerged from this philosophy. Tukey's boxplot was designed to be a quick and easy way to visualize the distribution of data. 3. Usage: I use boxplots during the exploratory phase. First, I assess correlations to an outcome I am interested in. Then I explore the top features during Exploratory Data Analysis (EDA). Boxplots are heavily used in my EDA. 4. Key Features of Boxplots: In one quick visualization, boxplots display distribution summary, outliers, skewness, and it facilitates comparisons between multiple groups or categories. 5. The Box: The box spans from the first quartile (Q1) to the third quartile (Q3). This range, known as the interquartile range (IQR), contains the middle 50% of the data. The line inside the box represents the median (the second quartile, Q2), which divides the dataset into two equal halves. 6. The Whiskers: The whiskers extend from the box to show the range of the data. A common approach is to extend them to the smallest and largest values within 1.5 times the IQR from the first and third quartiles, respectively. Data points outside this range are considered outliers and are sometimes plotted as individual points. 7. Outliers: These are data points that lie beyond the end of the whiskers. They are not part of the bulk of the data and may indicate variability in the data, experimental errors, or novel findings. Explore these! 8. Skewness: If the median is not equidistant from Q1 and Q3, or if the whiskers are of unequal lengths, it suggests that the data is skewed. 9. Key Issues: One issue I run into commonly is multimodal distributions (these are distributions with multiple "humps" like a camel's back). These usually indicate a group-wise pattern, which needs to be explored by group. === There’s a lot more to learning Data Science for Business. I'd like to help. I put together a free on-demand workshop that covers the 10 skills that helped me make the transition to Data Scientist: And if you'd like to speed it up, I have a live workshop where I'll share how to use ChatGPT for Data Science: If you like this post, please reshare ♻️ it so others can get value.
    013281
  4. Matt Dancho (Business Science)✓@mdancho84
    Boxplots are one of the most useful tools in my Data Science arsenal. In 6 minutes, I'll teach you 6 years of using box plots for EDA and problem-solving. Let's dive in. 1. What is a boxplot? A boxplot is a standardized way of displaying the distribution of data based on a five-number summary: minimum, first quartile (Q1), median, third quartile (Q3), and maximum. 2. Invention: The boxplot was invented in 1969 by John Tukey, as part of his pioneering work in data visualization. Tukey's EDA emphasized the importance of using simple graphical and numerical methods to start understanding the data before making any assumptions about its underlying distribution or applying complex statistical models. The boxplot emerged from this philosophy. Tukey's boxplot was designed to be a quick and easy way to visualize the distribution of data. 3. Usage: I use boxplots during the exploratory phase. First, I assess correlations to an outcome I am interested in. Then I explore the top features during Exploratory Data Analysis (EDA). Boxplots are heavily used in my EDA. 4. Key Features of Boxplots: In one quick visualization, boxplots display distribution summary, outliers, skewness, and it facilitates comparisons between multiple groups or categories. 5. The Box: The box spans from the first quartile (Q1) to the third quartile (Q3). This range, known as the interquartile range (IQR), contains the middle 50% of the data. The line inside the box represents the median (the second quartile, Q2), which divides the dataset into two equal halves. 6. The Whiskers: The whiskers extend from the box to show the range of the data. A common approach is to extend them to the smallest and largest values within 1.5 times the IQR from the first and third quartiles, respectively. Data points outside this range are considered outliers and are sometimes plotted as individual points. 7. Outliers: These are data points that lie beyond the end of the whiskers. They are not part of the bulk of the data and may indicate variability in the data, experimental errors, or novel findings. Explore these! 8. Skewness: If the median is not equidistant from Q1 and Q3, or if the whiskers are of unequal lengths, it suggests that the data is skewed. 9. Key Issues: One issue I run into commonly is multimodal distributions (these are distributions with multiple "humps" like a camel's back). These usually indicate a group-wise pattern, which needs to be explored by group. === There’s a lot more to learning Data Science for Business. I'd like to help. I put together a free on-demand workshop that covers the 10 skills that helped me make the transition to Data Scientist: And if you'd like to speed it up, I have a live workshop where I'll share how to use ChatGPT for Data Science: If you like this post, please reshare ♻️ it so others can get value.
    Download
    821895160.5K
  5. Dr. Vahid Aryadoust@VahidAryadoust
    Boxplots are extremely helpful in describing data. In these two videos I demonstrate how to generate Boxplots in SPSS and interpret them. #Statistics #SPSS #boxplot
    013
  6. Show more posts