#Dataplotly içeren gönderiler

#Dataplotly

X'te #Dataplotly kullanan herkese açık gönderiler.

İlgili etiketler

  1. Geoinnova@GeoInnovaASL
    📊 ¿Conoces DataPlotly? Este complemento de #QGIS permite crear gráficos interactivos directamente a partir de los atributos de tus capas, sin necesidad de exportar los datos a otras herramientas. #DataPlotly #GIS #SIG #Geospatial #QGISPlugin
    0617771
  2. Gis3w@_Gis3W_
    #G3WSUITE version 3.1 will be released on November 18th! Many new features: greater integration with the #QGIS API, visualization of graphics created with #DataPlotly plugin, printing of atlas, new online editing tools ... and much more ...
    İndir
    023
  3. Gis3w@_Gis3W_
    #G3WSUITE 3.2 is coming! Great news about #DataPlotly plugin integration! Activate charts and make them dynamic with filters based on map content
    İndir
    01846
  4. Calep Pimienta@CalepPimienta
    Tarde pero seguro! A ver si me mantengo en el resto del #30daysmapchallenge 🎉Ahí van los de la semana👇🏽 1/9: Radiación solar media estacional en México.
    İndir
    1011
  5. Calep Pimienta@CalepPimienta
    @CalepPimienta
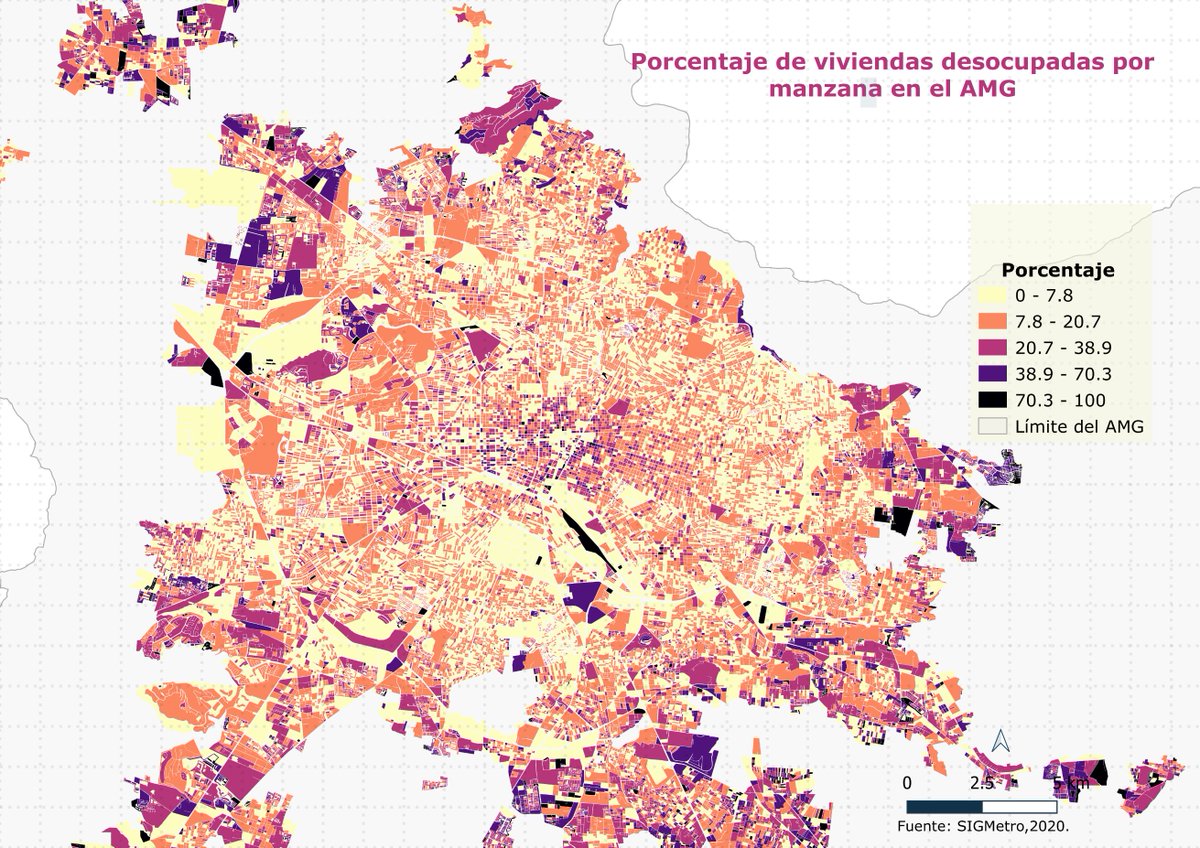
    Mapa 9: A petición de @NevandoAndo un mapita del porcentaje de viviendas desocupadas por manzana en el AMG. La info es descargable del SIGmetro, no hay como tal un registro de "número de viviendas" desocupados pero algo es algo. #30daysmapchallenge
    İndir
    226
  6. Calep Pimienta@CalepPimienta
    @CalepPimienta
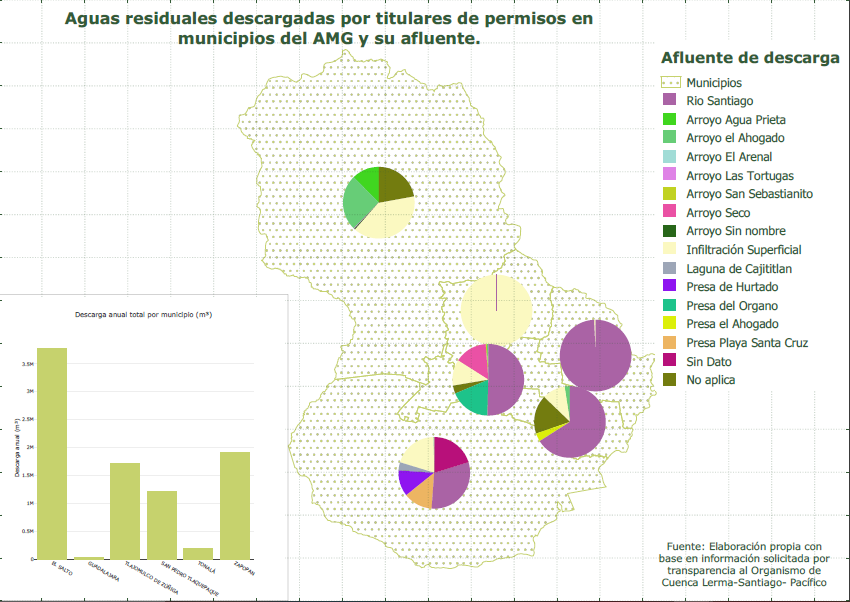
    Del #30DayMapChallenge el #10 para @SilverFighter22, quedan pendientes otros pero de pronto el mapa de A. Residuales por titulares de permisos en AMG (157) y el afluente al que van (solicitado por transparencia, 2019) rolo base si quieren. Use complemento #DataPlotly 🤠🏭🚱
    İndir
    002
  7. Faunalia@FaunaliaGIS
    Our #DataPlotly and the new QGribDownloader (thanks Enrico Ferreguti) showing up during the #QGIS workshop of Birds Eye View!
    027
  8. Ujaval Gandhi@spatialthoughts
    @ghtmtt Yes. Thank you for your work #DataPlotly . Quite a joy to see those interactive plots in QGIS.
    003
  9. Faunalia@FaunaliaGIS
    Presentazione di #DataPlotly. A brevissimo lanciamo il crowdfunding.. stay tuned!
    016
  10. Gis3w@_Gis3W_
    #G3WSUITE 3.2 is coming! Great news about #DataPlotly plugin integration! Carry out your searches and filter the graphs based on the search results #QGIS
    İndir
    0522
  11. Faunalia@FaunaliaGIS
    Matteo Ghetta #DataPlotly talk recorded during the last #QGIS User Conference in A Coruña. Have a look at it!
    004
  12. Bleumar@val_orsi
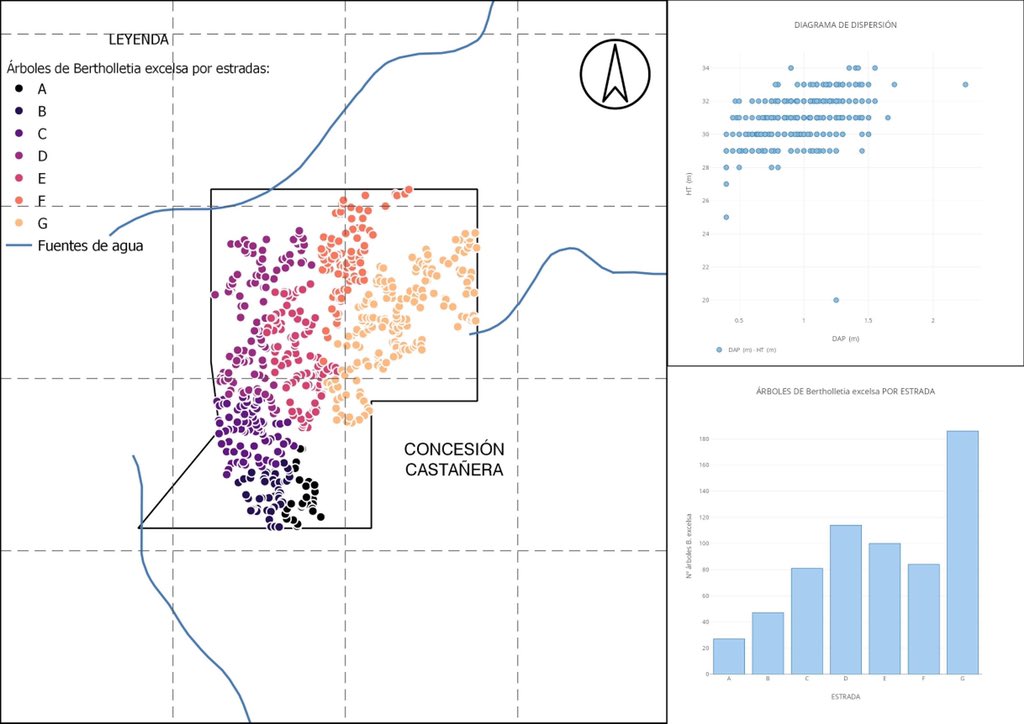
    Les presento un mapa de dispersión de árboles de castaña (B. excelsa) geo-referenciadas por estradas con dos gráficos realizados con #dataplotly : - Diagrama de dispersión entre los DAP (diámetro a la altura del pecho) y HT (altura total) = correlación + #30díasdegráficos
    İndir
    1414
  13. Daha fazla gönderi göster