Apollo Trading✓

@ApolloTradingHQ

Developed trading frameworks for crypto’s liquidity-driven markets. Season 1: Applications Closed.

3 Following6.6K Followers175 Posts
  1. Apollo Trading✓@ApolloTradingHQ
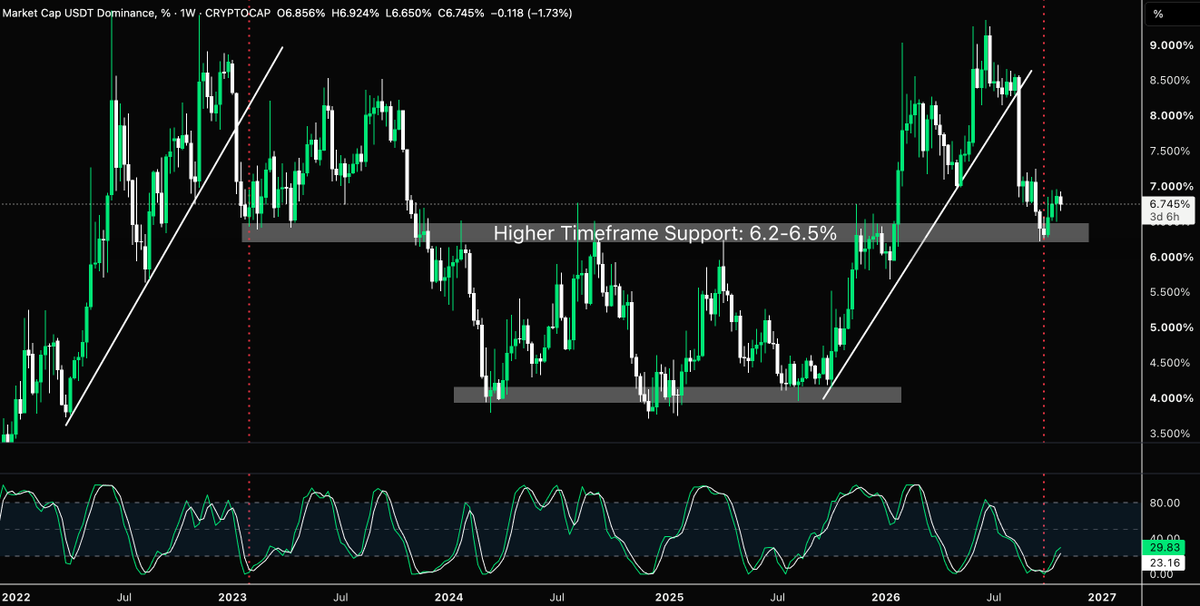
    Many won't like this, but USDT dominance is suggesting the crypto market could have further downside ahead. The last time USDT dominance bottomed around this same region in early 2023, it went on to rally from roughly 6.3% to above 8%, remaining elevated for several months. Fast forward to today, and we're seeing another reaction from the 6.2–6.5% support zone, with weekly Stoch RSI beginning to turn higher from oversold conditions. The initial bounce has been relatively modest compared to previous recoveries. If history is any indication, there could still be room for further upside in stablecoin dominance, which would generally be a headwind for $BTC and the broader crypto market. One of several reasons we're remaining cautious on crypto for now.
    Download
    44191.2K
  2. Apollo Trading✓@ApolloTradingHQ
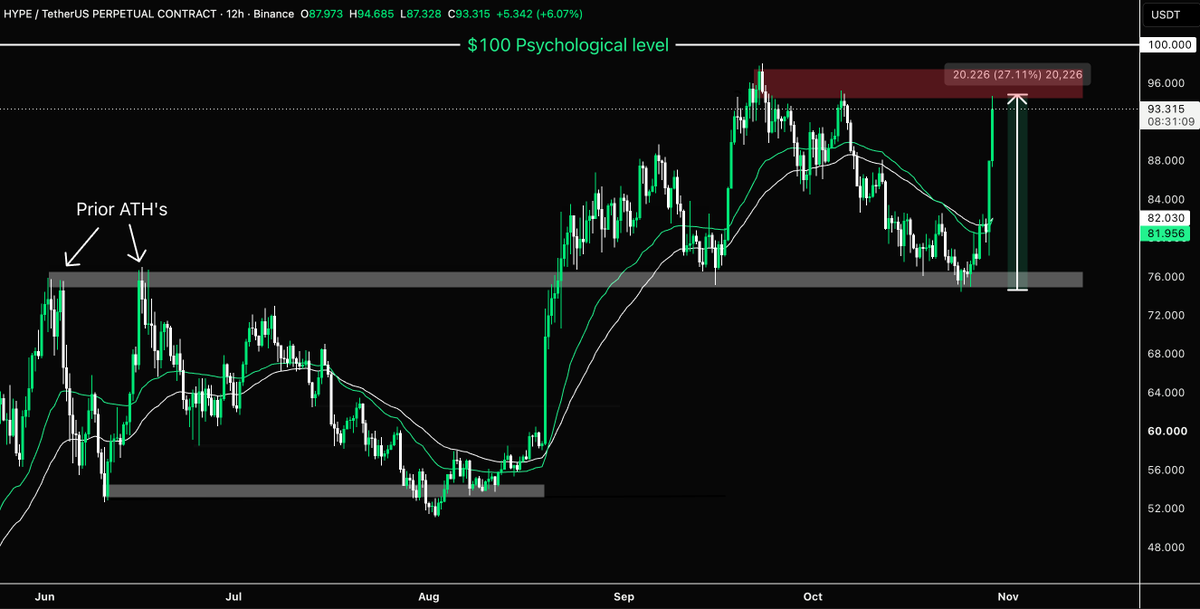
    $HYPE has surged 27% from the lows, reaching $94 🟢 We identified the $75 region as a key macro support level, highlighting the potential reversal following a liquidity sweep and reclaim of the previous ATHs. We caught the long inside Apollo, and following this explosive rally, we've now taken profits and are waiting for price to rebalance. This is why identifying key support and liquidity levels matters. Mark your levels. Build your plan. Let price come to you. Then execute 🎯
    Download
    Apollo Trading @ApolloTradingHQ
    $HYPE up 10% from the lows! 🚀 We identified the liquidity sweep of the previous ATHs around $75 and highlighted a potential long opportunity once price reclaimed the level. Since then, $HYPE has rallied roughly 10% from the lows, with an explosive move coming in just the last few hours since our previous post. Just as we called.. $HYPE was 'gearing up for an explosive rally'. And of course, we caught the long inside Apollo. 🎯
    117512.4K
  3. Apollo Trading✓@ApolloTradingHQ
    $HYPE up 10% from the lows! 🚀 We identified the liquidity sweep of the previous ATHs around $75 and highlighted a potential long opportunity once price reclaimed the level. Since then, $HYPE has rallied roughly 10% from the lows, with an explosive move coming in just the last few hours since our previous post. Just as we called.. $HYPE was 'gearing up for an explosive rally'. And of course, we caught the long inside Apollo. 🎯
    Download
    Apollo Trading @ApolloTradingHQ
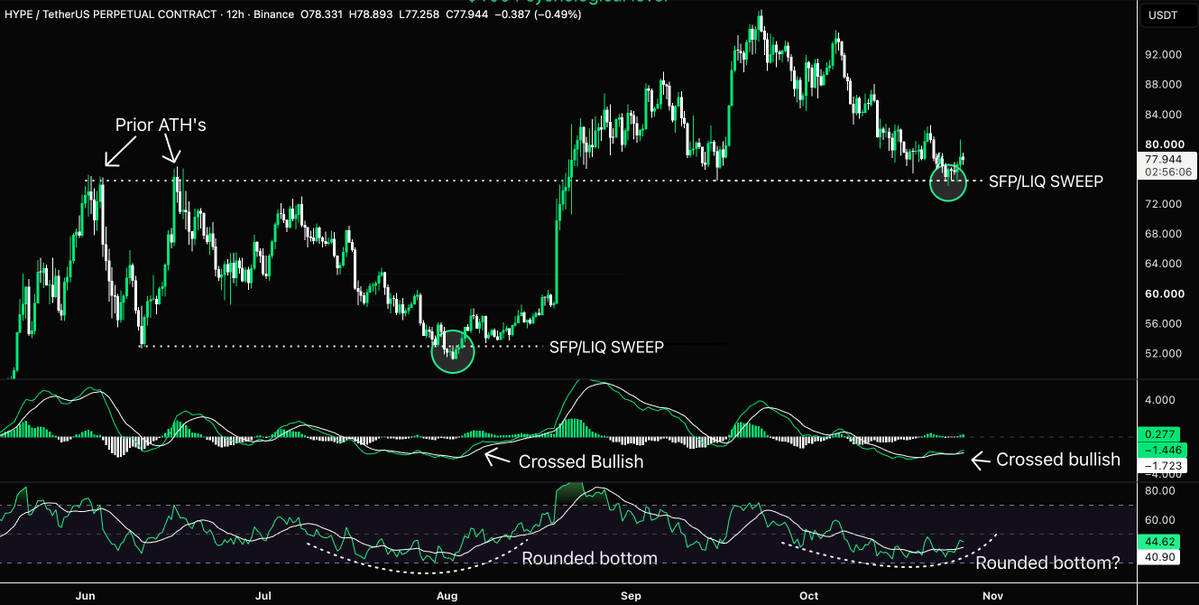
    Is $HYPE gearing up for another explosive rally? 🟢 Take a look at these two setups on the 12H chart. The similarities are difficult to ignore. Back in August, HYPE swept the previous lows around $53 before reclaiming support. At the same time: - MACD crossed bullish. - RSI began forming a rounded bottom. What followed? A rally of over 80% towards new all-time highs. Fast forward to today, and we're seeing a similar combination of signals. HYPE has just swept the recent lows around $74–75, right into a major historical resistance zone formed by previous all-time highs. Once again, MACD has crossed bullish, while RSI is showing signs of another rounded bottom. It's important to note, that HYPE remains in a clear downtrend, with lower highs and lower lows still intact. Bulls need to reclaim $80–82 before we can start talking about a meaningful shift in structure. But with price reacting at a major historical level and momentum beginning to improve, this is certainly one to watch. Are we about to see a reversal/relief rally on?
    1619475K
  4. Apollo Trading✓@ApolloTradingHQ
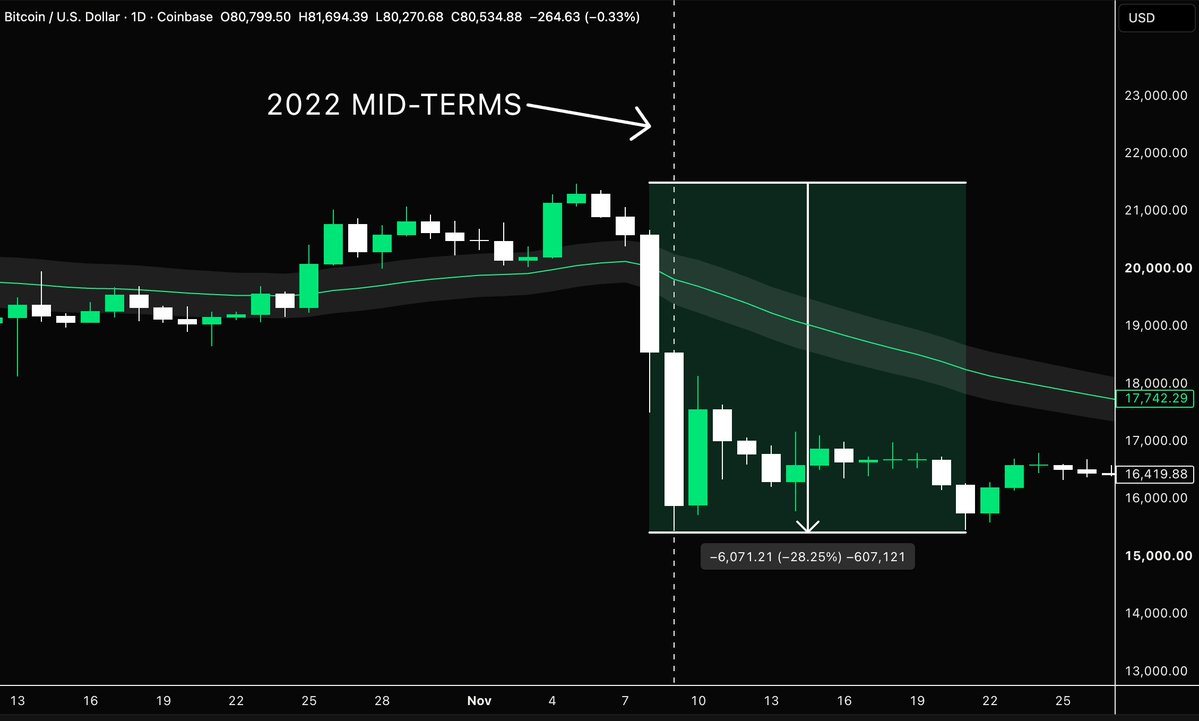
    The previous two US midterms have one thing in common: significant Bitcoin downside 🚨 In 2018, BTC plunged approximately 47% in the weeks following the election. In 2022, BTC collapsed from around $20,500 to $15,500 in the days surrounding the vote. Two elections. Two significant downside moves. Of course, correlation doesn't imply causation. But with the 2026 midterms approaching and BTC once again showing bearish market structure, this historical price action is worth watching.
    Download
    9626978
  5. Apollo Trading✓@ApolloTradingHQ
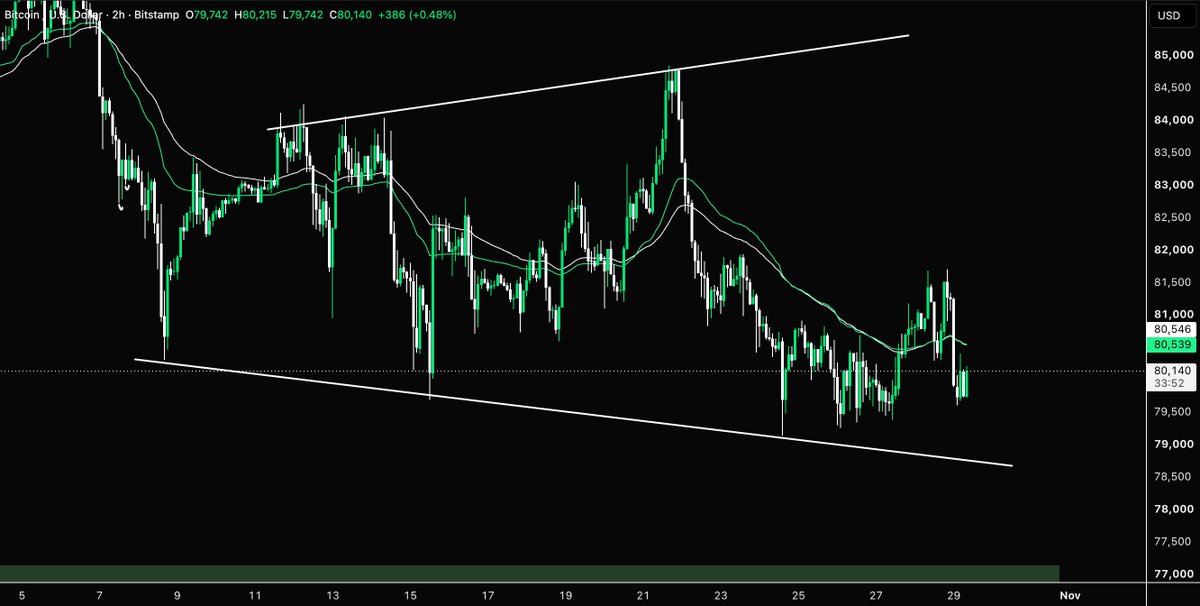
    $BTC is developing a potential megaphone pattern on the lower timeframes. Unlike traditional ranges, where price respects relatively clear horizontal boundaries, megaphones are characterised by expanding swings, often producing higher highs and lower lows. These are typically difficult to trade, as what initially looks like a breakout can quickly reverse. Liquidity sweeps occur on both sides of the structure, leaving stop losses increasingly vulnerable. On BTC, we're seeing volatile swings within this expanding structure, while the broader 4h trend remains bearish. In these conditions, patience is key. Rather than chasing moves in the middle of the pattern, the better opportunities often come from waiting for reactions at the extremes or a confirmed structural break.
    Download
    76341.4K
  6. Apollo Trading✓@ApolloTradingHQ
    FED LEAVES RATES UNCHANGED AS EXPECTED ⚠️ Now we wait for the important part - Warsh's press conference.
    Apollo Trading @ApolloTradingHQ
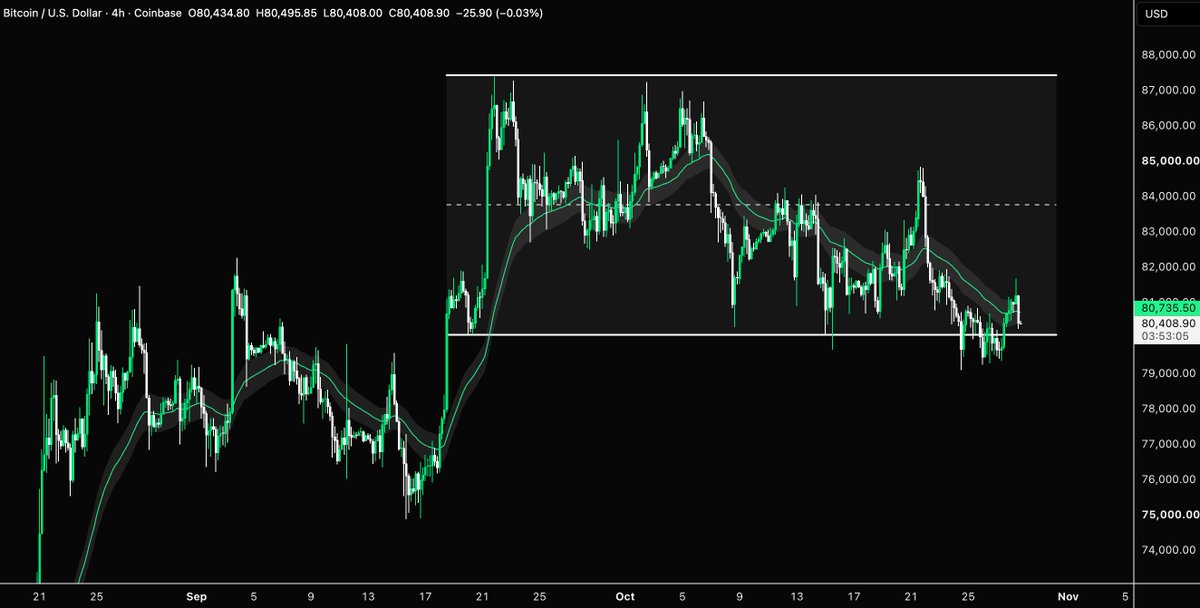
    $BTC is approaching a key decision point ahead of FOMC 🚨 Price is hovering around $80K, with the broader 4H structure remaining bearish since $87k - following a lower high and lower low structure. Two scenarios we're listening for during Warsh's speech: 🟢 Dovish Warsh: If he signals a more accommodative stance heading into December, we could see a relief rally. 🔴 Hawkish Warsh: If he suggests hikes later in the year then that likely opens the door towards the mid $70Ks.
    77242.4K
  7. Apollo Trading✓@ApolloTradingHQ
    $BTC is approaching a key decision point ahead of FOMC 🚨 Price is hovering around $80K, with the broader 4H structure remaining bearish since $87k - following a lower high and lower low structure. Two scenarios we're listening for during Warsh's speech: 🟢 Dovish Warsh: If he signals a more accommodative stance heading into December, we could see a relief rally. 🔴 Hawkish Warsh: If he suggests hikes later in the year then that likely opens the door towards the mid $70Ks.
    Download
    104322.7K
  8. Apollo Trading✓@ApolloTradingHQ
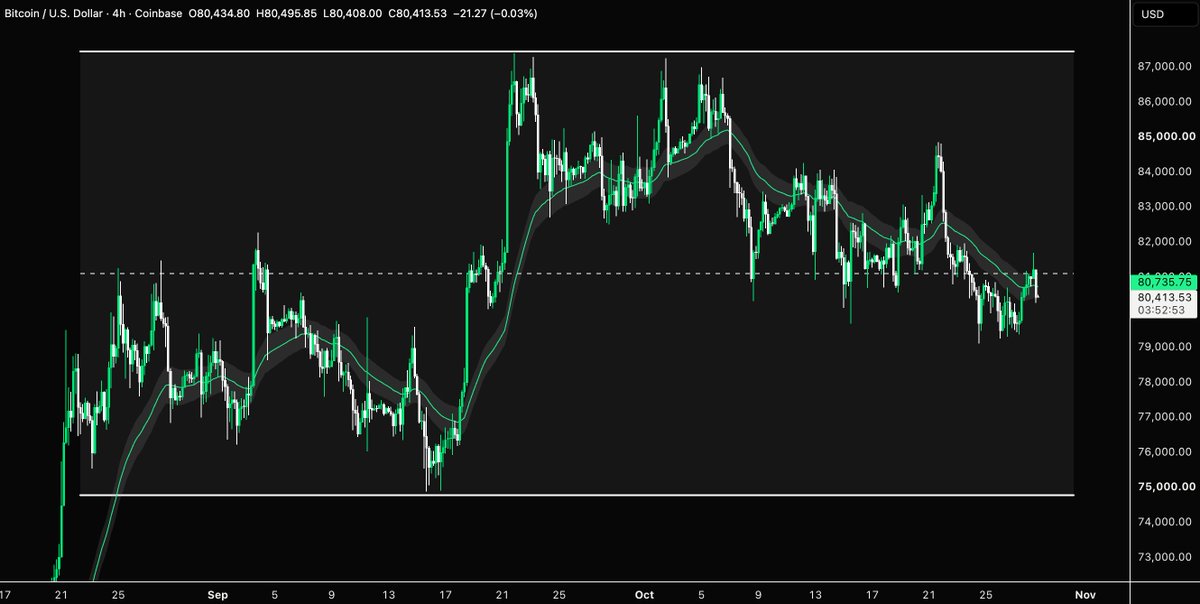
    There is no single right or wrong way to draw a trading range. Two traders can look at the same chart, identify slightly different ranges, and both have valid reasoning. The important thing is being able to justify your levels. A range should be supported by price action, whether that's repeated reactions, areas of acceptance, or clear support and resistance. Don't get caught up trying to draw the perfect range down to the exact dollar. What matters is understanding how price behaves around your levels and using that information to build a consistent trading plan. Here are 3 examples of the same price action, with 3 valid ranges.
    Download
    117331K
  9. Apollo Trading✓@ApolloTradingHQ
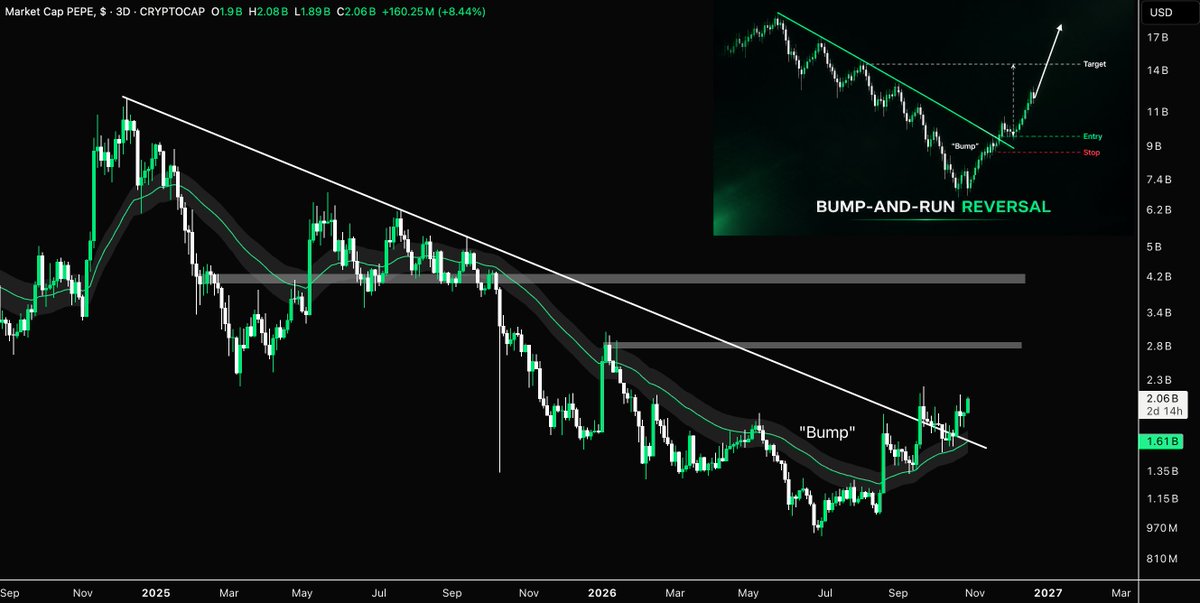
    $PEPE is showing signs of a potential major trend reversal 🐸 After almost two years of declining price action, an interesting bump-and-run reversal structure is developing on the 3D chart. 🟢 Breakout above the long-term descending trendline. 🟢 Reclaim of the moving average ribbon. 🟢 Higher lows forming as bullish momentum returns. Market cap is now approaching $2.1B, with the next major resistance around $2.8B. A successful breakout and retest would strengthen the reversal thesis, potentially opening the door towards $4.2B. Still early, but this is one of the most interesting higher-timeframe structures developing in the memecoin sector.
    Download
    109882.9K
  10. Apollo Trading✓@ApolloTradingHQ
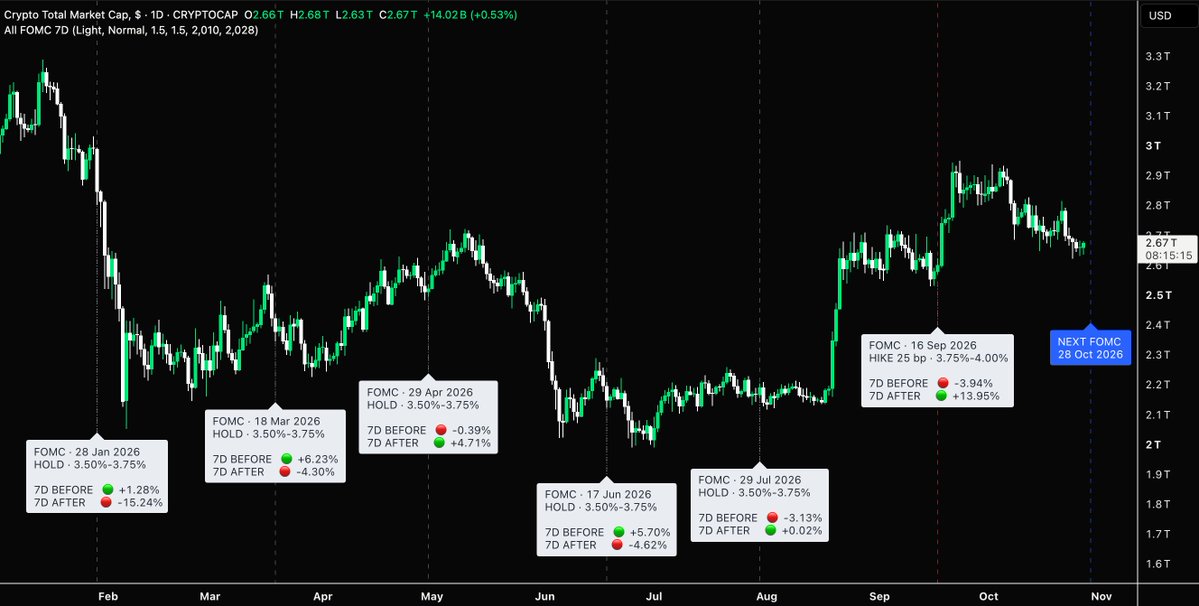
    With the next Fed meeting today, here's how TOTAL crypto market cap has performed around every FOMC in 2026 🚨 When crypto rallied in the 7 days BEFORE FOMC: • January: +1.28% → −15.24% after • March: +6.23% → −4.30% after • June: +5.70% → −4.62% after When crypto declined in the 7 days BEFORE FOMC: • April: −0.39% → +4.71% after • July: −3.13% → +0.02% after • September: −3.91% → +13.95% after The pattern is interesting. Every time crypto rallied into FOMC, it declined over the following week. Every time crypto sold off into FOMC, it either rallied or remained flat over the following week. With crypto once again heading into FOMC following a sustained decline, could another relief rally be on the cards?
    Download
    118311.8K
  11. Apollo Trading✓@ApolloTradingHQ
    Is $HYPE gearing up for another explosive rally? 🟢 Take a look at these two setups on the 12H chart. The similarities are difficult to ignore. Back in August, HYPE swept the previous lows around $53 before reclaiming support. At the same time: - MACD crossed bullish. - RSI began forming a rounded bottom. What followed? A rally of over 80% towards new all-time highs. Fast forward to today, and we're seeing a similar combination of signals. HYPE has just swept the recent lows around $74–75, right into a major historical resistance zone formed by previous all-time highs. Once again, MACD has crossed bullish, while RSI is showing signs of another rounded bottom. It's important to note, that HYPE remains in a clear downtrend, with lower highs and lower lows still intact. Bulls need to reclaim $80–82 before we can start talking about a meaningful shift in structure. But with price reacting at a major historical level and momentum beginning to improve, this is certainly one to watch. Are we about to see a reversal/relief rally on?
    Download
    77273.7K
  12. Apollo Trading✓@ApolloTradingHQ
    We called the $ZEC reversal zone 🎯 Don't believe us? Check the quoted post. After flipping bearish around $1,465, we identified $1,050 as the area where we'd start looking for longs again. Price subsequently fell to $1,050 before finding buyers and reversing. Now, $ZEC is developing a potential rounded bottom on the 4H, with improving RSI momentum and a series of higher lows. The next major test? $1,330–1,375 resistance. A confirmed breakout confirms the rounded bottom pattern and opens the door towards $1,450–1,500. From bearish at $1,465 to watching for buyers at $1,050. We don't miss.
    Download
    Apollo Trading @ApolloTradingHQ
    We flipped bearish on $ZEC around $1,465, as bullish momentum was clearly fading (check quoted post). Since then, price has continued to print lower highs and lower lows, with ZEC recently trading in the $1,100s down around 30% from its highs. Attention now shifts towards $1,050, where we'll be watching for signs of a reversal and potentially looking to get long on $ZEC again. Bearish at $1,465. Potential buyers at $1,050. Structure over narrative.
    1215719.8K
  13. Apollo Trading✓@ApolloTradingHQ
    We flipped bearish on $ZEC around $1,465, as bullish momentum was clearly fading (check quoted post). Since then, price has continued to print lower highs and lower lows, with ZEC recently trading in the $1,100s down around 30% from its highs. Attention now shifts towards $1,050, where we'll be watching for signs of a reversal and potentially looking to get long on $ZEC again. Bearish at $1,465. Potential buyers at $1,050. Structure over narrative.
    Download
    36176.7K
  14. Apollo Trading✓@ApolloTradingHQ
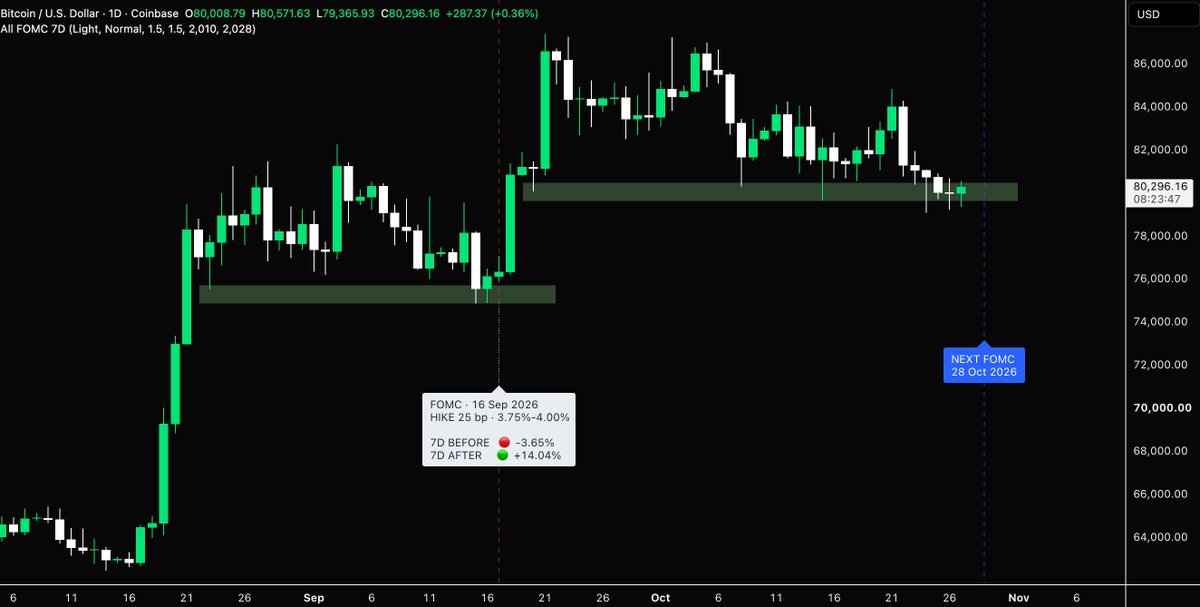
    Could $BTC be setting up for another post-FOMC rally? 🚨 At the previous FOMC meeting, BTC had fallen 3.65% in the preceding 7 days. What followed? A 14.04% rally over the next 7 days. Fast forward to today, and BTC is once again heading into FOMC following a sustained decline, this time testing a key daily support zone around $80K. Could we see history repeat itself?
    Download
    116331.1K
  15. Apollo Trading✓@ApolloTradingHQ
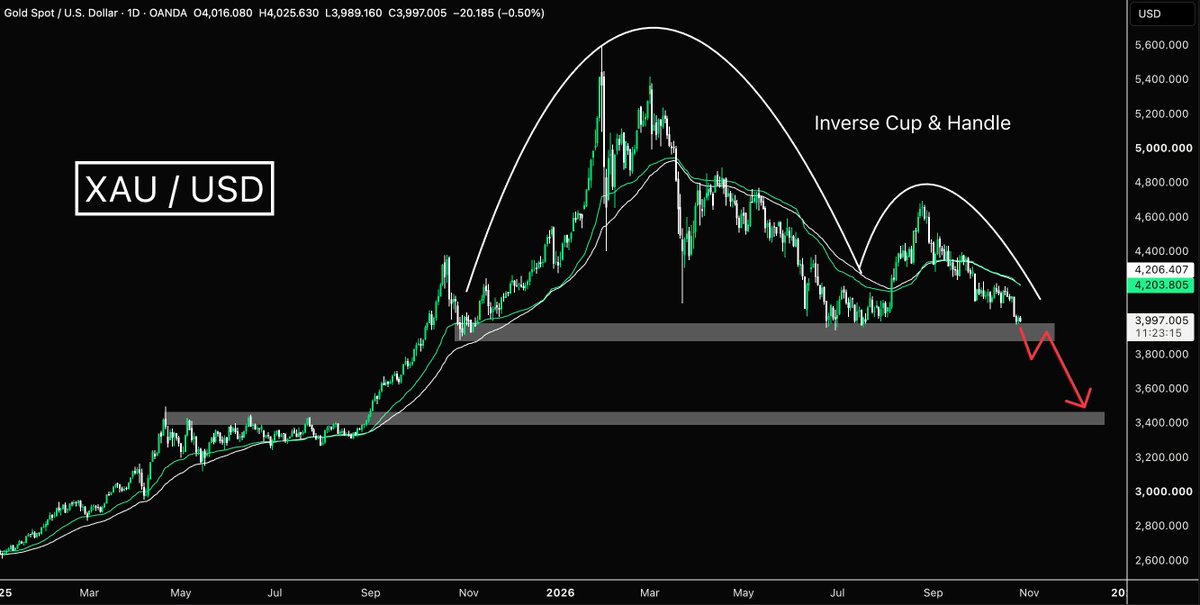
    Is GOLD preparing for another major leg lower? 🚨 After an extraordinary rally throughout 2025 and into 2026, $XAUUSD is now showing a very different market structure. Gold has been printing a series of lower highs, with each relief rally failing to reclaim the previous peak. Zoom out, and a potential inverse cup and handle formation is also developing on the daily chart. The key level to watch is $3,900–4,000, a major support zone that buyers have defended repeatedly. A confirmed breakdown below this support could open the door towards $3,400–3,500. Until buyers can reverse the sequence of lower highs, the broader structure continues to favour more downside.
    Download
    7522894
  16. Apollo Trading✓@ApolloTradingHQ
    Everyone is watching $ZEC, but could $XMR be preparing for a period of relative outperformance? The XMR/ZEC pairing has spent much of 2026 in a significant downtrend, with Monero consistently losing ground against Zcash. However, two interesting technical developments are beginning to emerge: Firstly, the pairing is attempting to break above a descending trendline that has capped price since March. Secondly, following a breakdown below the major 0.50 support level, XMR/ZEC has recovered strongly from its lows and is now attempting to reclaim that same level. Could it be a bullish range deviation? A sustained reclaim of 0.50–0.51 would strengthen that possibility and suggest a shift in relative momentum. The EMA's have also started turning higher, providing another early indication of improving momentum. With so much attention focused on ZEC, it's worth asking whether Monero could be approaching a period of relative strength. Is the XMR/ZEC trend finally beginning to turn?
    Download
    Apollo Trading @ApolloTradingHQ
    $XMR is quietly putting together one of the more interesting charts in the market. On the daily chart, Monero has established a clear sequence of higher highs and higher lows following its bullish break of market structure in August. Price continues to trade above its rising moving averages, with the next test around $650–660; break that and there is little between XMR and new ATH's. But zoom out to the XMR/BTC weekly chart, and things get even more interesting. After nearly eight years of declining resistance dating back to 2018, Monero has finally broken above its multi-year trendline against Bitcoin. That's a significant technical development. Weekly RSI is approaching 70, momentum is strengthening, and XMR is now approaching a major historical resistance zone around 0.0085–0.0095 BTC. A break above this zone and $XMR likely enters a new phase of long-term outperformance.
    86381.5K
  17. Apollo Trading✓@ApolloTradingHQ
    $XMR is quietly putting together one of the more interesting charts in the market. On the daily chart, Monero has established a clear sequence of higher highs and higher lows following its bullish break of market structure in August. Price continues to trade above its rising moving averages, with the next test around $650–660; break that and there is little between XMR and new ATH's. But zoom out to the XMR/BTC weekly chart, and things get even more interesting. After nearly eight years of declining resistance dating back to 2018, Monero has finally broken above its multi-year trendline against Bitcoin. That's a significant technical development. Weekly RSI is approaching 70, momentum is strengthening, and XMR is now approaching a major historical resistance zone around 0.0085–0.0095 BTC. A break above this zone and $XMR likely enters a new phase of long-term outperformance.
    Download
    9201135.3K
  18. Apollo Trading✓@ApolloTradingHQ
    The S&P 500 opens the week green, despite geopolitical tensions, inflation fears and uncertainty surrounding FOMC. Will that give crypto the short term boost it needs to prevent a breakdown of $80k?
    Download
    6517814
  19. Apollo Trading✓@ApolloTradingHQ
    Don't let a few green candles sway your thinking. Zoom out. What is the $BTC 4H chart actually telling us? A clear downtrend, with price continuing to print lower highs and lower lows. Bitcoin has failed to meaningfully reclaim the $80–81K support zone. Instead, the recent bounce looks more like a retest of former support, potentially confirming it as resistance. Meanwhile, the Trend Worm continues to slope downwards and act as dynamic resistance overhead. Until buyers can reclaim these levels and break the sequence of lower highs, there's little reason to change the short-term bearish bias. A sustained reclaim of $82K would be the first meaningful sign that the structure is shifting. Keep it simple. Expect further downside until price gives us a reason to think otherwise.
    Download
    Apollo Trading @ApolloTradingHQ
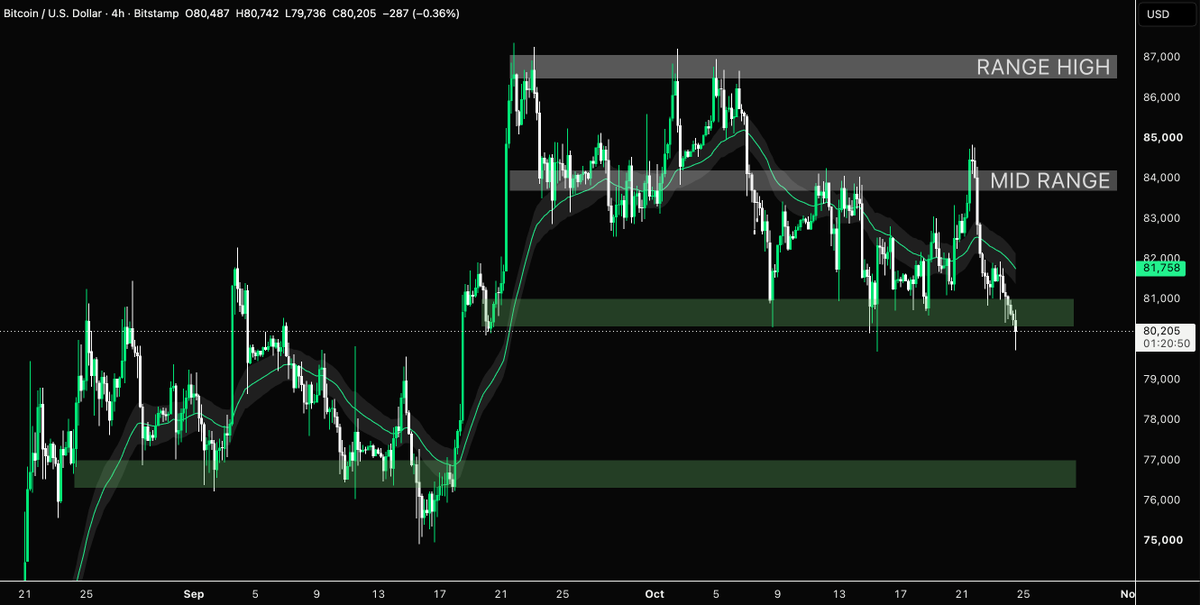
    🚨 $BTC BREAKS BELOW $80,000 After nearly a month of range-bound price action, BTC briefly breaks below the $80k support zone. Repeated failures to reclaim the $84K mid-range have allowed bears to establish a series of lower highs, with selling pressure continuing to build. The next key level to watch? A confirmed breakdown below $80K would open the door towards the next major demand zone around $76K–$77K. For bulls, a swift reclaim of the lost support is needed to avoid further downside. The range is under threat. Bears are gaining momentum.
    127311.1K
  20. Apollo Trading✓@ApolloTradingHQ
    🚨 $BTC BREAKS BELOW $80,000 After nearly a month of range-bound price action, BTC briefly breaks below the $80k support zone. Repeated failures to reclaim the $84K mid-range have allowed bears to establish a series of lower highs, with selling pressure continuing to build. The next key level to watch? A confirmed breakdown below $80K would open the door towards the next major demand zone around $76K–$77K. For bulls, a swift reclaim of the lost support is needed to avoid further downside. The range is under threat. Bears are gaining momentum.
    Download
    45222.3K
  21. Apollo Trading✓@ApolloTradingHQ
    Before you take another $BTC trade this week, look at the weekly chart 🚨 Bitcoin has failed to sustain its weekly breakout above $82K, followed by two consecutive bearish weekly closes back inside the range. The next major support levels to watch are $76.5K, $74K and $72.5K. Meanwhile, the weekly Stochastic RSI is showing signs of fading momentum, with a bearish cross. Given the current structure, it makes more sense to maintain a short-term bearish bias until price gives us a reason to reconsider. For bulls, that starts with a sustained reclaim of $82K, which would begin to challenge the bearish outlook. Until then, the weekly structure favours caution over optimism.
    Download
    119241.1K
  22. Apollo Trading✓@ApolloTradingHQ
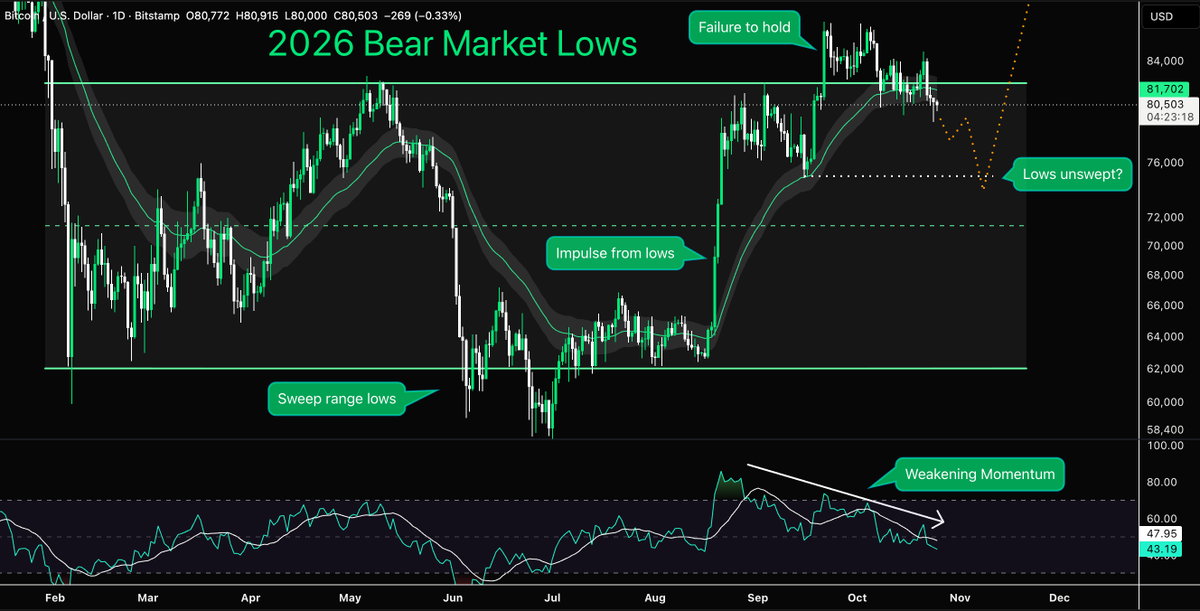
    Bitcoin contunues to repeat 2023 price structure 📈 We've been tracking this fractal since August, and the similarities continue to show. Both periods saw BTC sweep the range lows, before an impulsive recovery carried price towards major resistance. Both then broke above that resistance, only to fail to sustain the breakout. Interestingly, the Trend Worm provided dynamic support throughout much of both recoveries, before price began losing that support as momentum weakened. Even the RSI tells a similar story, with declining momentum accompanying the deterioration in price structure. But there's one important difference, so far. In 2023, Bitcoin swept the previous swing lows before reversing sharply higher. In 2026, the equivalent lows around $74–75K remain unswept. With BTC momentum struggling, could another liquidity sweep be developing?
    Download
    97231.1K
  23. Show more posts