Elliott Wave International✓

@elliottwaveintl

EWI is the world's largest market forecasting firm providing forecasts of every major financial market in the world. https://t.co/emSJdPTBzi

433 Following54K Followers13.4K Posts
  1. Elliott Wave International✓@elliottwaveintl
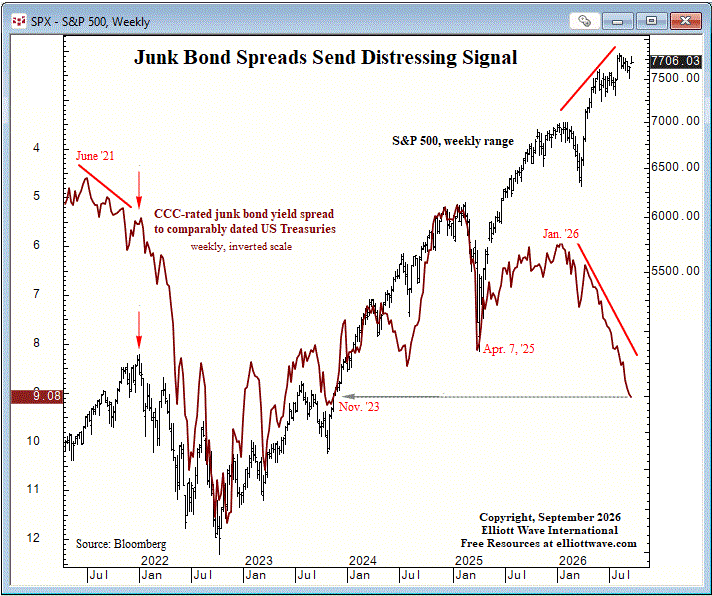
    Junk bonds continue to sound the alarm. CCC-rated junk bond spreads are widening while the S&P 500 remains near its August peak. Historically, when these markets diverge, stocks have eventually caught up with the trend in junk spreads. And the bigger the divergence, the bigger the potential catch-up. This is a chart we'll be watching closely. See 18 charts sounding an alarm in the markets:
    Download
    2213546278.6K
  2. Elliott Wave International✓@elliottwaveintl
    XRP crashed 73%. Then it surged 68%. So, is the worst finally over? Near the August low, our Crypto Pro Service told subscribers: "We are counting down the final waves of the correction." What followed was a sharp 68% rebound. But despite that rally, XRP remains well below its previous high. That raises a much bigger question: Was this the start of a new bull run, or just another rally within a larger correction? Our new report, Crypto Rally: Breakout or Bull Trap?, examines the Elliott wave patterns in Bitcoin, Ethereum, XRP, Cardano and Solana to uncover what the charts suggest could happen next. The outlook may surprise you. Read it now:
    Download
    34164.3K
  3. Elliott Wave International✓@elliottwaveintl
    A record rally can make risk feel remote. The S&P 500 Momentum Index tracks the 100 fastest-rising S&P stocks. Its record 44% second-quarter gain shows just how quickly investors’ favorites advanced. The dot-com comparison on this chart raises a question: What does that strength tell us about risk? Explore our free report, The Most Dangerous Market in History?, and see which charts are flashing warning signals:
    Download
    816626K
  4. Elliott Wave International✓@elliottwaveintl
    Elliott Wave International
    RT @MurrayGunnEWI: The AI boom is showing cracks. And semiconductor stocks may be telling us more. The Philadelphia Semiconductor Index SOX flashed a bearish engulfing pattern in July. After a corrective bounce, the decline has resumed. The AI trade has been a powerful engine for stocks. What happens if it starts running in reverse?
    0701.3K
  5. Elliott Wave International✓@elliottwaveintl
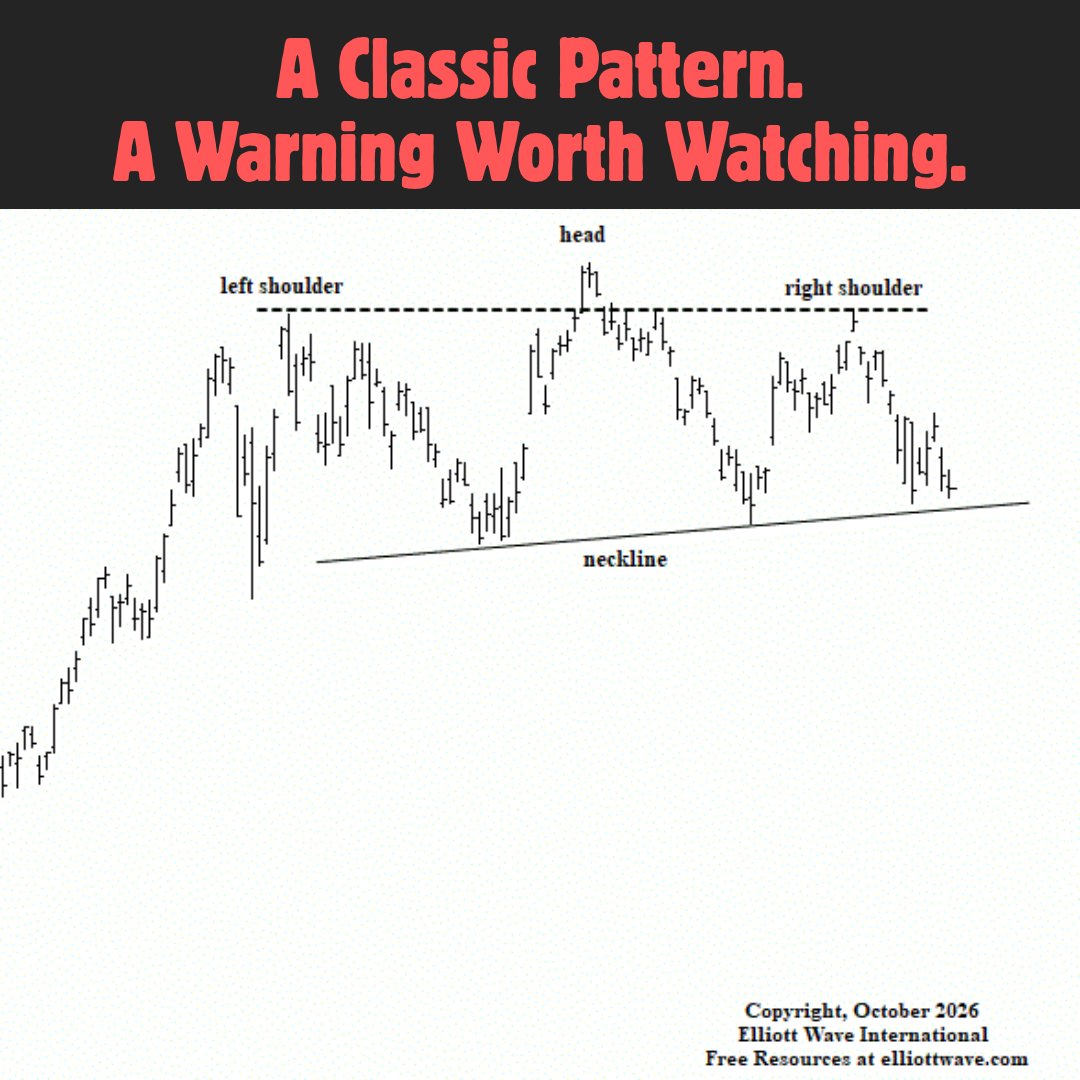
    This head and shoulders pattern just popped up on one of the charts we're watching. With a potential right shoulder in place, the key level to watch is the neckline. A break below it would add to the concern. It's one chart. But it's not the only warning sign we're keeping an eye on. Our updated free report, The Most Dangerous Market in History?, examines 18 charts that raise important questions about the market's current condition. Read it free -
    Download
    67507.6K
  6. Elliott Wave International✓@elliottwaveintl
    The stock market is rising. But are investors acting like they believe in the rally? Consumer discretionary stocks are failing to keep pace with the S&P 500, while their relative strength versus consumer staples is weakening. A similar divergence appeared before the 2020 Covid crash. It’s a warning worth watching. Our updated free report, The Most Dangerous Market in History: 18 Flashing Red Charts, examines more signals investors shouldn’t ignore. Check it out now:
    Download
    46354.5K
  7. Elliott Wave International✓@elliottwaveintl
    Crude oil jumps... again! How high will it go? Test drive our Global Market Perspective for just $27 to get our big-picture outlook for oil and 50+ global markets:
    Download
    33183.7K
  8. Elliott Wave International✓@elliottwaveintl
    More than 90% of Stoxx 600 stocks were above their 200-day moving averages earlier in this advance. At the latest high? Just 76%. The European market is still rising, but fewer stocks are participating. See what's in store for global stocks, bonds, gold & silver, forex, cryptos and more with your $27 Global Market Perspective test drive (offer ends today).
    Download
    211534.5K
  9. Elliott Wave International✓@elliottwaveintl
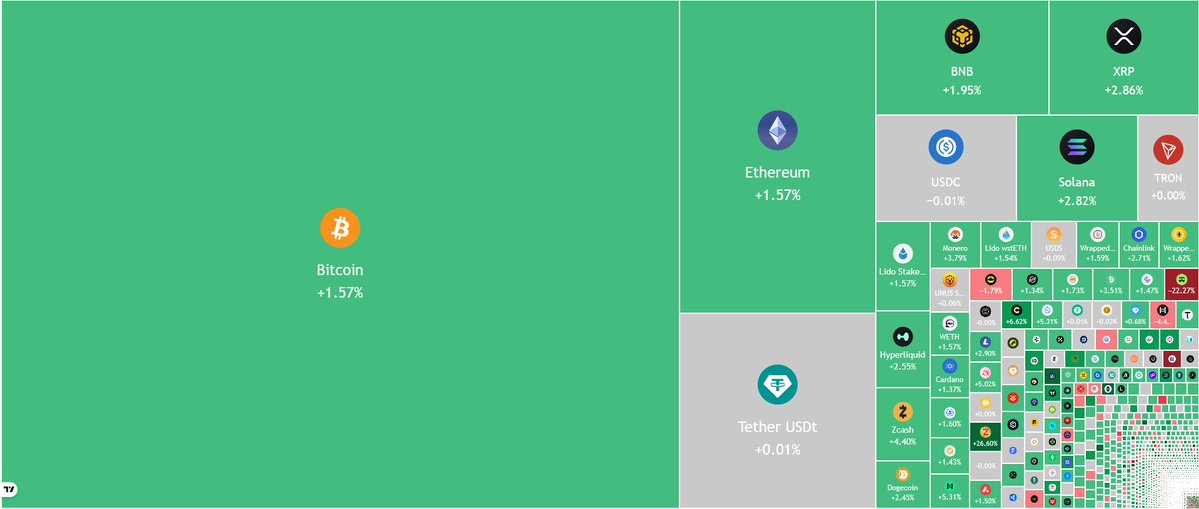
    Crypto pulls back. Bitcoin has shed roughly $3,500, and weakness is showing across the sector. Is this just a setback, or are the price patterns signaling something more? Get answers in our new report, "The Crypto Rally: Breakout or Bull Trap?" -
    Download
    32213.5K
  10. Elliott Wave International✓@elliottwaveintl
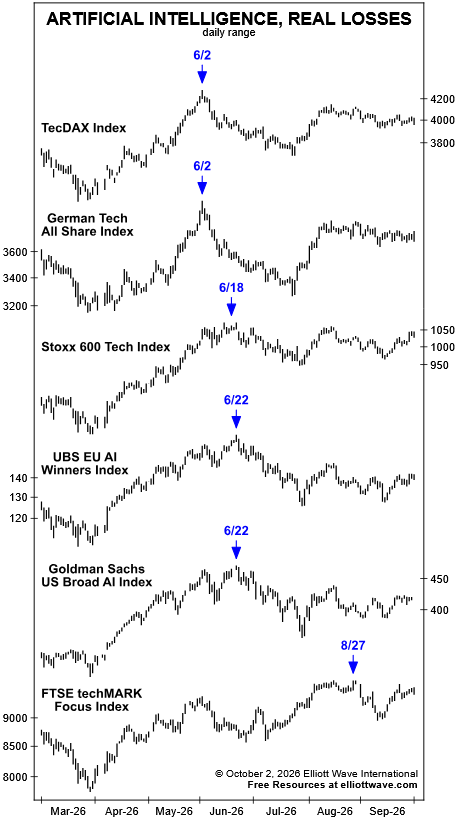
    European technology shares have been one of the hottest sectors in the market. But is the strength sustainable? Our October Global Market Perspective examines four critical technology indexes and the growing disconnect between AI enthusiasm and the financial realities beneath it. Read the full issue now for just $27 - offer ends October 23!
    Download
    33173.1K
  11. Elliott Wave International✓@elliottwaveintl
    From our new report, “The Crypto Rally: Breakout or Bull Trap?” “The Crypto Fear & Greed Index reached 74, signaling “greed,” near Bitcoin’s recent highs. Remarkably, investors were showing greater optimism than they did at Bitcoin’s previous all-time high the prior October.” Read it now and see what’s next for Bitcoin, Ethereum, Solana, XRP & Chainlink:
    Download
    31153.3K
  12. Elliott Wave International✓@elliottwaveintl
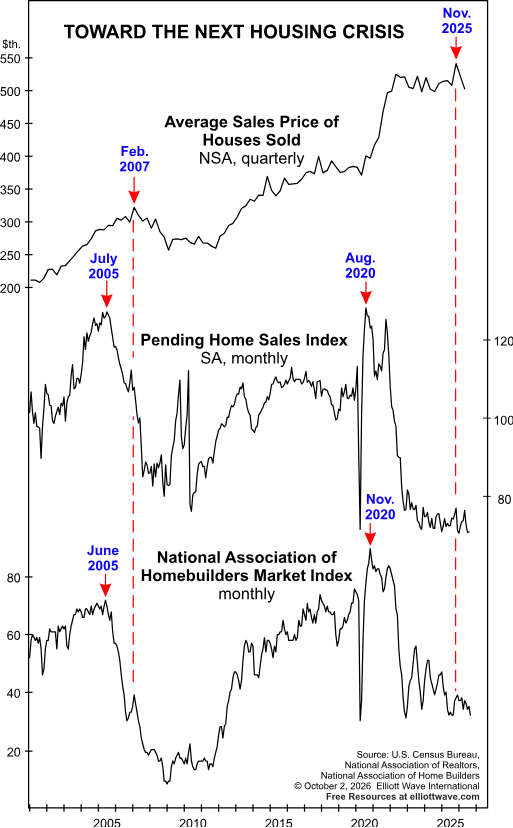
    U.S. home prices are still rising according to some measures. But the October GMP notes that real home values have fallen for 14 consecutive months. Other housing indicators are weakening too, including pending home sales and builder sentiment. The headline price isn't necessarily the whole housing story. Get analysis and forecasts for 50+ global markets inside your $27 Global Market Perspective Test Drive.
    Download
    35334.7K
  13. Elliott Wave International✓@elliottwaveintl
    Bitcoin and Ethereum have bounced back. But does the price action support the optimism? And what do Solana, XRP and Chainlink reveal that the headlines might be missing? Our new report, The Crypto Rally: Breakout or Bull Trap?, examines what the charts are saying across these major cryptocurrencies. Get our crypto analysis and outlook:
    Download
    34263.8K
  14. Elliott Wave International✓@elliottwaveintl
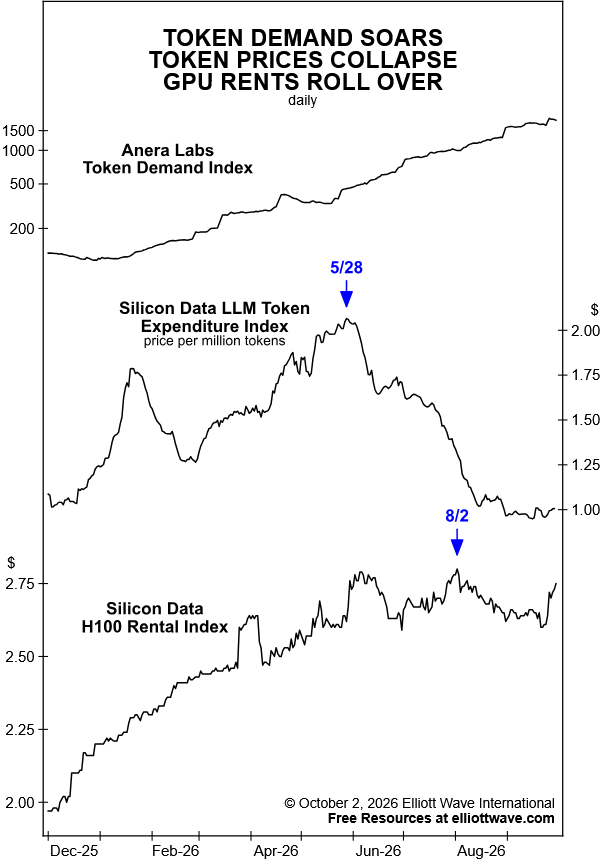
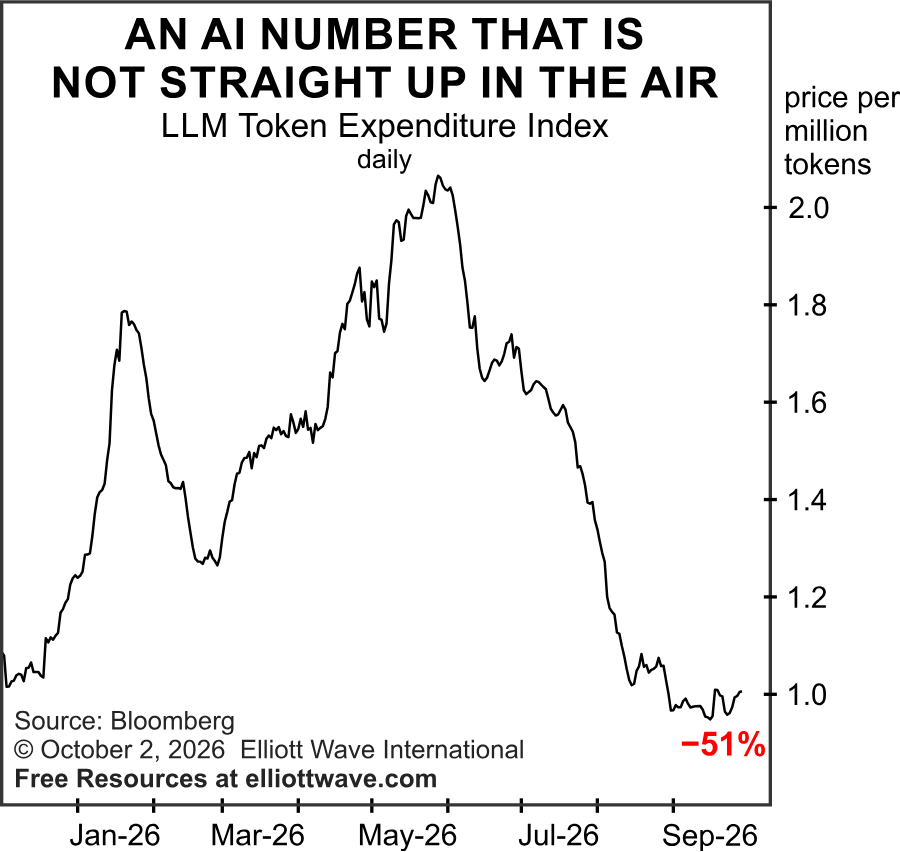
    Watch this chart - straight from our October Global Market Perspective: "Even as demand for AI tokens keeps soaring, token prices have collapsed. Silicon Data’s LLM Token Expenditure Index, which tracks what users pay per million tokens, is off 51% since its May 28 peak, and on August 31 it fell below $1 for the first time in its history. Meanwhile, Silicon Data’s H100 Rental Index appears to be topping after climbing 42% from December 1 to August 2. In addition, Nvidia just agreed to pay $12.9 billion for Hugging Face. In other words, demand is soaring, prices are collapsing, and the world’s most valuable company appears to be buying insurance against its best customers." Identify opportunities, manage risk and stay ahead of major trends in 50+ global markets with your $27 test drive:
    Download
    46317.3K
  15. Elliott Wave International✓@elliottwaveintl
    Cryptos are rallying today, but... Is this a breakout of bull trap? Our new report explores what Elliott wave patterns and investor sentiment may be signaling for Bitcoin, Ethereum and altcoins, including Solana, XRP and Chainlink. Read it now:
    Download
    43183.8K
  16. Elliott Wave International✓@elliottwaveintl
    AI demand keeps rising. AI token prices keep falling. The LLM Token Expenditure Index is down 51% from its May peak and fell below $1 for the first time. So what happens when the hottest technology story in the market becomes cheaper and cheaper to monetize? Get answers + forecasts for 50+ global markets for just $27:
    Download
    56335.6K
  17. Elliott Wave International✓@elliottwaveintl
    Big market moves can happen anywhere. See where the next global opportunity is unfolding when you test drive Global Market Perspective for just $27.
    Download
    58344.4K
  18. Elliott Wave International✓@elliottwaveintl
    🚨 Stock market valuation hits new record. See 18 charts that show danger ahead - free:
    Robert Prechter @RobertPrechter
    The tech stocks influence on the S&P Composite drove the index's annualized dividend yield in August to 1.06%, its lowest ever. The August 2026 bullet clearly stands out as being further to the right than any year-end bullet plotted on the chart, the most extreme previous reading having occurred at year-end 1999 at 1.13%.
    14233.6K
  19. Robert Prechter✓@RobertPrechter
    The tech stocks influence on the S&P Composite drove the index's annualized dividend yield in August to 1.06%, its lowest ever. The August 2026 bullet clearly stands out as being further to the right than any year-end bullet plotted on the chart, the most extreme previous reading having occurred at year-end 1999 at 1.13%.
    Download
    210498.7K
  20. Elliott Wave International✓@elliottwaveintl
    Did Nasdaq just flash a warning? Yesterday, the index’s low met at the intersection of two converging trendlines. A clear break below this could be telling. See our forecasts for stocks, forex, cryptos, gold, silver and 50+ global markets. Test drive Global Market Perspective for just $27:
    Download
    313505.1K
  21. Elliott Wave International✓@elliottwaveintl
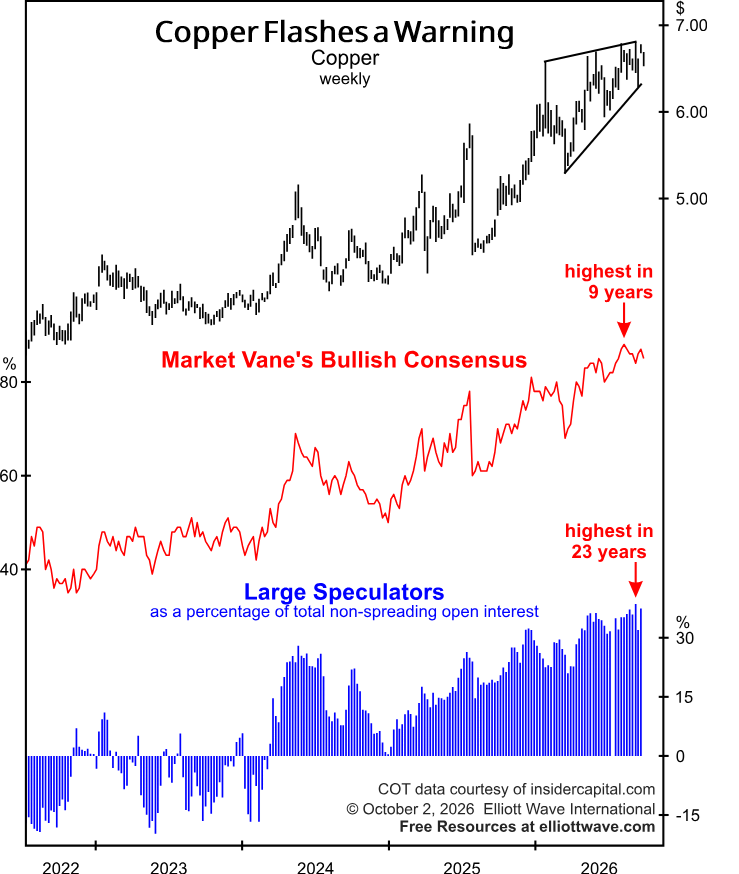
    Copper is often called “Dr. Copper” because of its broad exposure to economic activity. Now look at the sentiment. Market Vane's bullish consensus reached 90, a nine-year extreme. Large speculators were the most bullish they've been in 23 years. When virtually everyone is positioned for continued strength, what happens if copper stops cooperating. For a limited time you can test drive our Global Market Perspective for just $27 (65% off):
    Download
    3241107.1K
  22. Elliott Wave International✓@elliottwaveintl
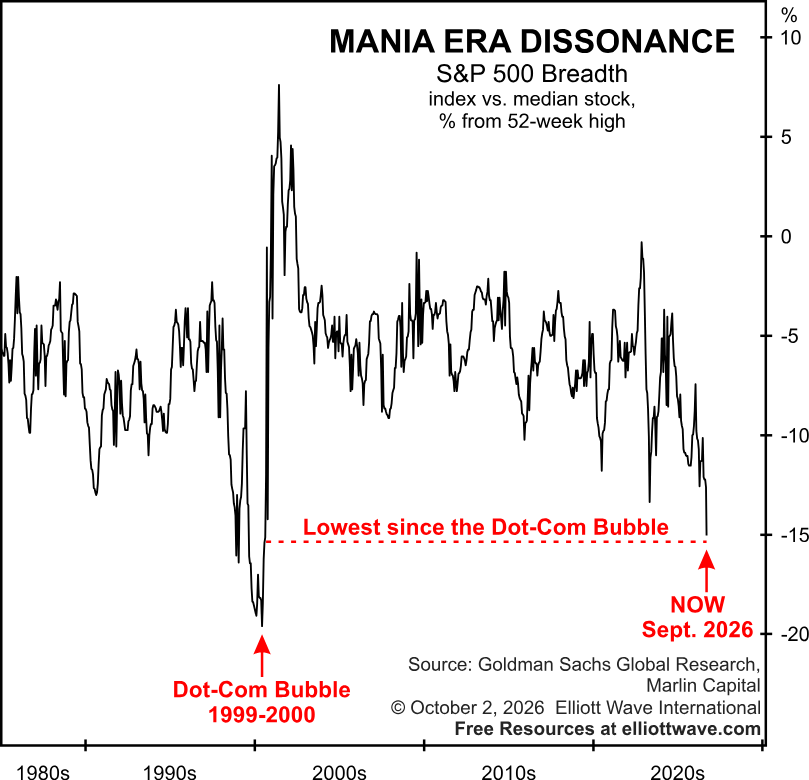
    🚨 This breadth measure just delivered its most insistent sell signal since 2000. This Goldman Sachs indicator measures the gap between the S&P 500 and the median stock in the index. The September reading was the lowest since the dot-com peak. Our freshly-updated report dives into 18 eye-opening charts that are flashing warning signals - read it free:
    Download
    3319806.8K
  23. Show more posts