Python for data beginners (start here, not with advanced ML):
1/ Learn lists and dictionaries first.
They are the foundation of almost everything in Pandas.
2/ Then open a CSV with Pandas
3/ Filter one column
4/ That’s enough for week 1.
#Python#DataAnalysis#Pandas
Statisticians and data enthusiasts 📊: How do you typically assess the assumption of normality in your datasets? Visual plots, statistical tests, or other methods? Share your go-to techniques! 🧐 #Statistics#DataAnalysis#DataScience
Starting the week with insights, not guesses. Built a Month-over-Month sales analysis using SQL.
Turning raw data into decisions.📊
#SQL#Data#DataAnalysis
Stop struggling with VLOOKUP
Use XLOOKUP instead
It looks left, right, up, and down + handles errors cleanly
=XLOOKUP(A2, B:B, C:C, "Not found")
This one change saves hours
What’s one Excel formula you still Google every time?
#ExcelTips#DataAnalysis#BeginnerFriendly
How to practice SQL when you don’t have a job yet
1/ Use free online tools (SQLZoo, Mode Analytics dataset, or Excel Power Query)
2/ Download free public data (sales, or government open data)
3/ Build 3 simple projects and put them on GitHub or LinkedIn
#SQLTips#DataAnalysis
📈 Parametric tests assume more, but can be more powerful. 📉 Non-parametric tests assume less, making them robust for non-normal or ordinal data.
Knowing when to use each is a key statistical skill. 🔑
#Statistics#Research#DataAnalysis
Starting your PhD journey or diving deep into data analysis?
Here’s a thread on the best data analysis tools every PhD student should know!
#DataAnalysis#PhDTools
Excel beginners: Stop using VLOOKUP in 2026.
XLOOKUP does everything VLOOKUP does… plus looks left, handles missing values better, and is easier to write
Example:
=XLOOKUP(A2, B:B, C:C, "Not found")
Try it today
#ExcelTips#DataAnalysis#Excel
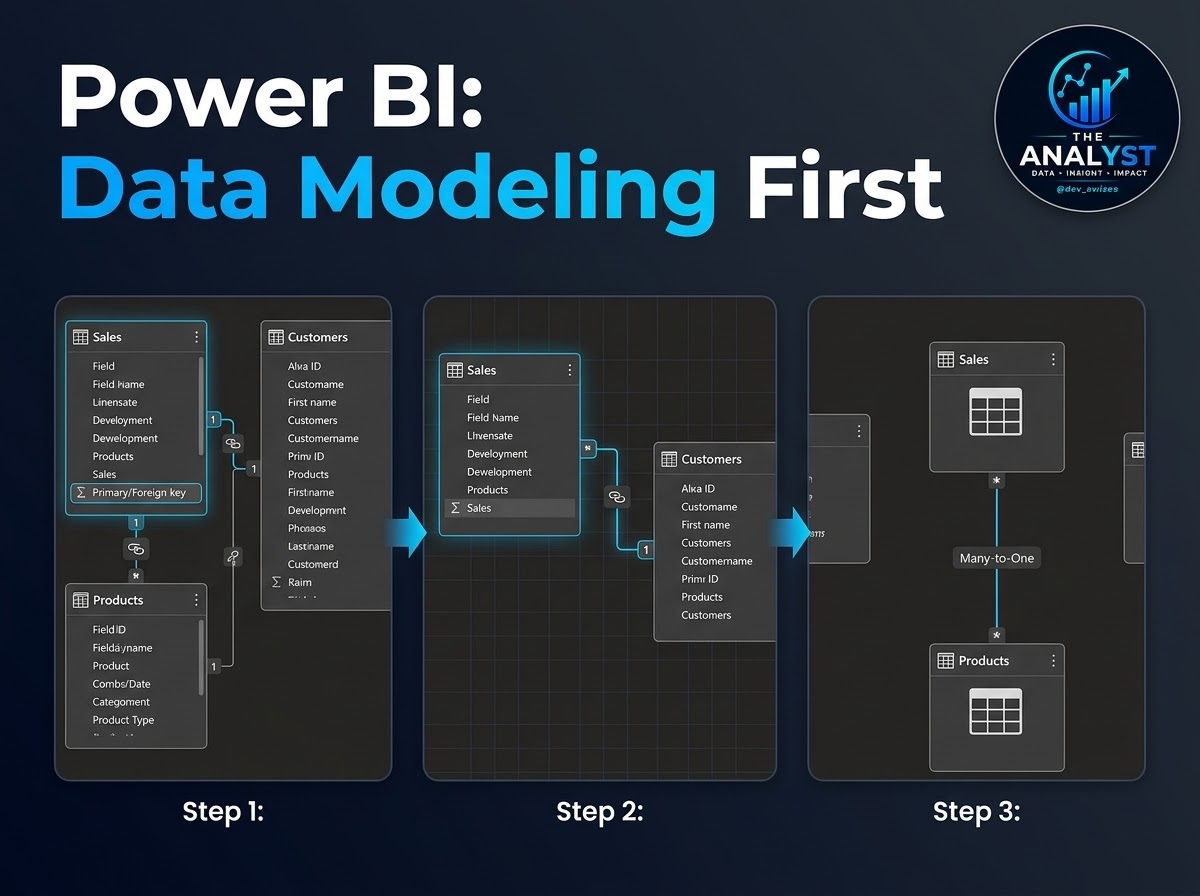
Power BI tip for beginners:
Don’t start with fancy visuals.
Start with a proper data model.
- Import your Excel file
- Go to Model view
- Create relationships (one-to-many)
- Then build your first table or card visual
Clean model = fast reports.
#PowerBI#DataAnalysis
Want to become a data analyst but aren’t sure what industry to go into? We always recommend pivoting into a data role that relates to your background. Data is heavily used in all industries and having business acumen can give you leverage in the interview process!
#dataanalysis
Historical data shows a 99% decline in measles mortality long before the vaccine was ever introduced. When analyzing public health, context on deaths versus cases reveals a drastically different story than the narrative often promoted today. #PublicHealth#DataAnalysis