Posty z #Boxplot
#Boxplot
Publiczne posty w X, które używają #Boxplot.
Powiązane hashtagi

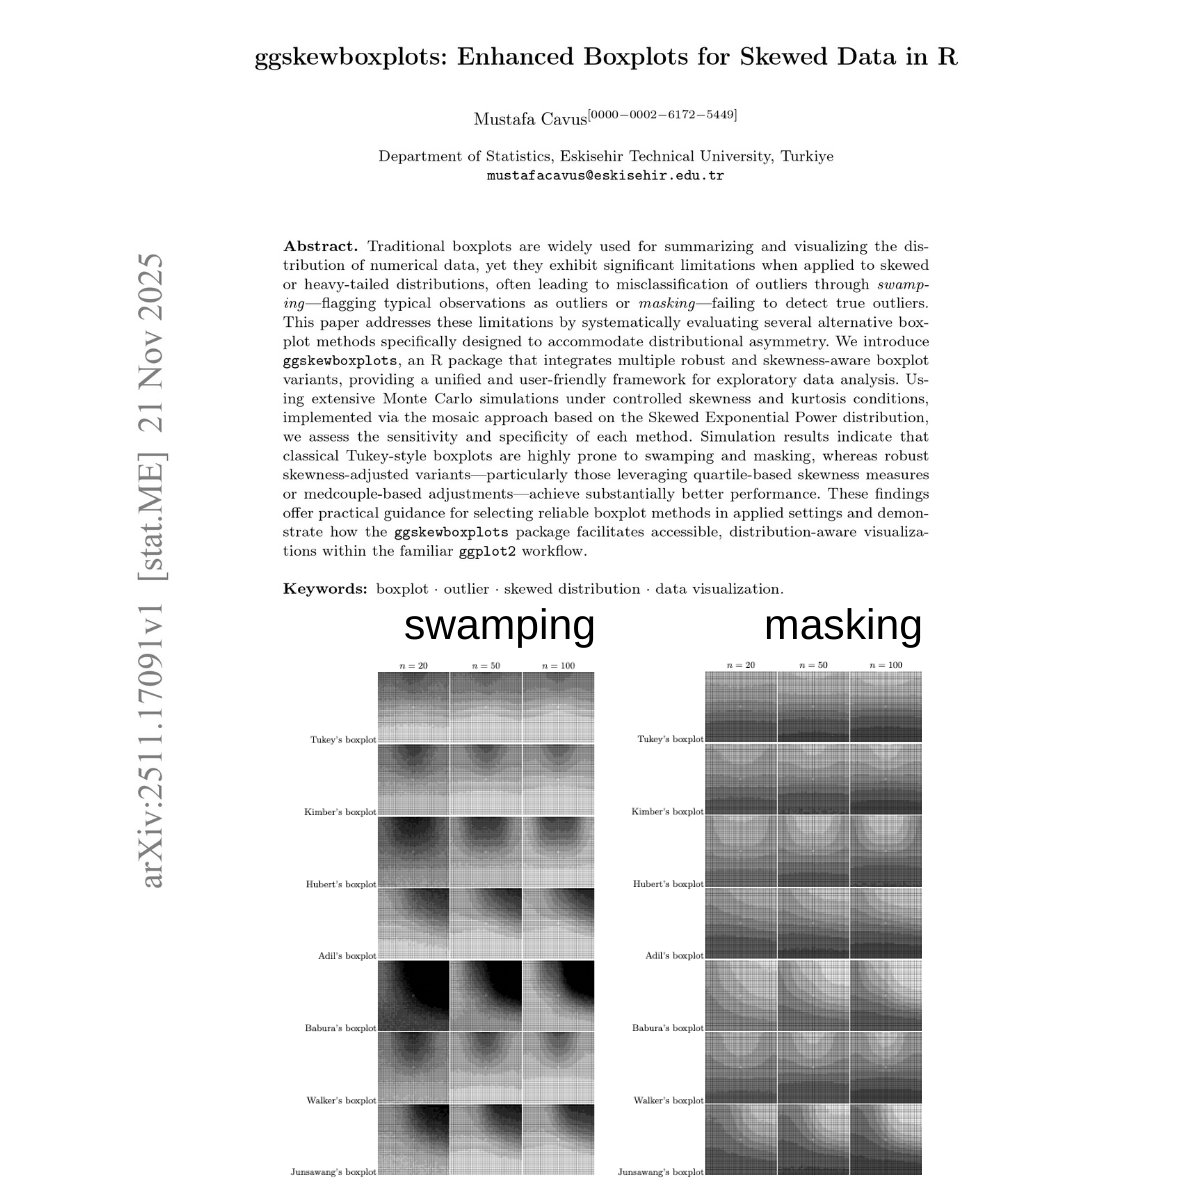
Mustafa Çavuş@mustafa__cavusStill using #boxplot for #outlier detection without considering data distribution? Tukey boxplot can mislead when data is skewed: Swamping → normal points flagged as outliers Masking → real outliers hidden I created an R package for solving this problem! Let's check it out 👇005218
Mihaela Bozukova@MBozukovaVisualizing summary statistics in a #boxplot is great. But don't forget to explore the underlying data distribution. Thanks to @JustinMatejka for this great educational dataset. #30DayChartChallenge | #Day27 | #educational #dataviz #Rstats #ggplot2 #statistics #violinplot3113577
Frank Reinhold@Reinhold_EduStarting the day at #SIG32022 with Martin‘s presentation of our work on #boxplot representations an systematic #errors014
PhET Sims@PhETsimsThe Center and Variability simulation allows students to explore mean, median, range, Interquartile Range, and measures of spread by interacting with different kickers’ unique data distributions from kicks. #boxPlot #distributions1413644
Stats MDPI@Stats_MDPI📝The Integrated Violin-Box-Scatter (VBS) Plot to Visualize the Distribution of a Continuous Variable 👤by David W. Gerbing 📖 #ViolinPlot #BoxPlot #ScatterPlot #VBSPlot #RPackageLessR00013

Day 19: Wrote #r script to create this #boxplot on #trafficflow on state highway. Simply enough, but debugged and looked up functions. #100DaysofCode #programming #data #science #statistics #graph #transport024
BioVinci@BioVinciDeadline comes? Gotta submit the paper tomorrow? Don't worry. BioVinci just needs a few seconds to plot your data. Get it done now: #boxplot #phdlife #postdoc #biovinci #geneexpression #boxandwhiskerplot027
There is a lot of debate over #violin being better than #boxplot. Within the #data #science platform for researchers, we like the #raincloud plot, since it combines the best of 3 #plot types: violin, box & jitter. Also #visually #appealing #dataviz035271
Frank Reinhold@Reinhold_Edu#EARLISIG3 conference on #ConceptualChange in Zwolle is starting today. Happy to be here and discuss our ideas and study about specific source for errors when comparing #Boxplot representation.1110
BioVinci@BioVinciBox plots are not always intuitive to read. How do you compare two box plots? #boxplot #boxandwhiskerplot #biovinci #boxandwhisker146
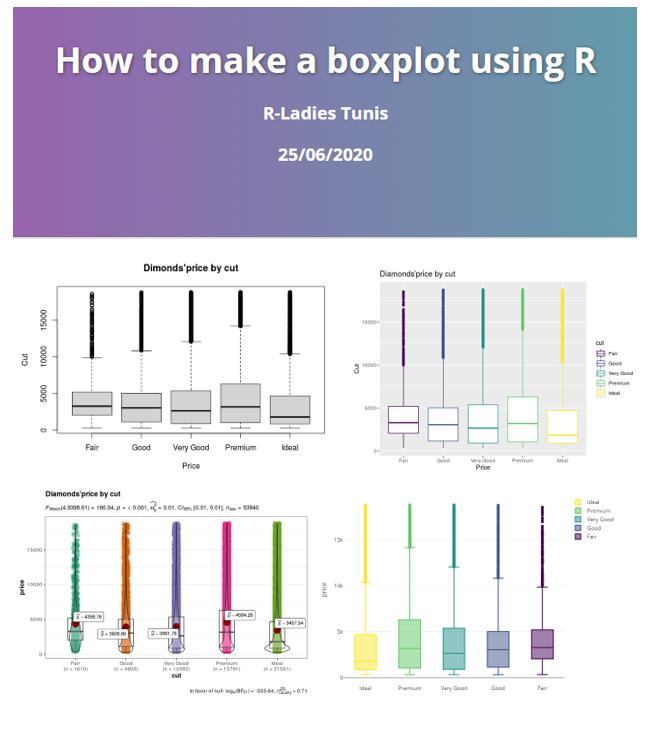
Catherine Kim, PhD @[email protected]@fishiintheCLast tip from @UQ_RUG today: How to create a #boxplot with data points and connect points between subjects with lines? Article that shows how here 👉 #R #RStats #tidyverse #ggplot2 #Coding #CodingNewbies #RLadiesUQ_RUG The University of Queensland R Users Group @UQ_RUG014
SemiWiki@DanielNenniIt’s Always About the Yield #BoxPlot #Clas-SiCWaferFabLtd #Infineon #JBSDiode #JunctionBarrierSchottky #MergedPNSchottky #Mosfet #MPSDiode #Sic #SiliconCarbide #Yield #YieldHUB002
Jan Koster@_Jan_Koster_There is a lot of debate over #violinplot being better than #boxplot. Within the #datascience platform for research, we like the #raincloudplot, since it combines the best of 3 #plot types: violin, box as well as jitter. It is also #visually #appealing00283
Women in Statistics and Data Science@WomenInStat"A #boxplot shows four main features about a variable: center, spread, asymmetry, and outliers..[ ]... #Violinplots also shows density of the variable." Make it in Python/R: #DataVisualization #Statistics #DataScience 2/20526
Dr. Vahid Aryadoust@VahidAryadoustI have just released a video on using RStudio to demonstrate generating boxplots with ggplot library. The link is as follows: To access the codes (scripts), check the GitHub link in the description section of the video. #rstudio #ggplot2 #boxplot007
- Pokaż więcej postów