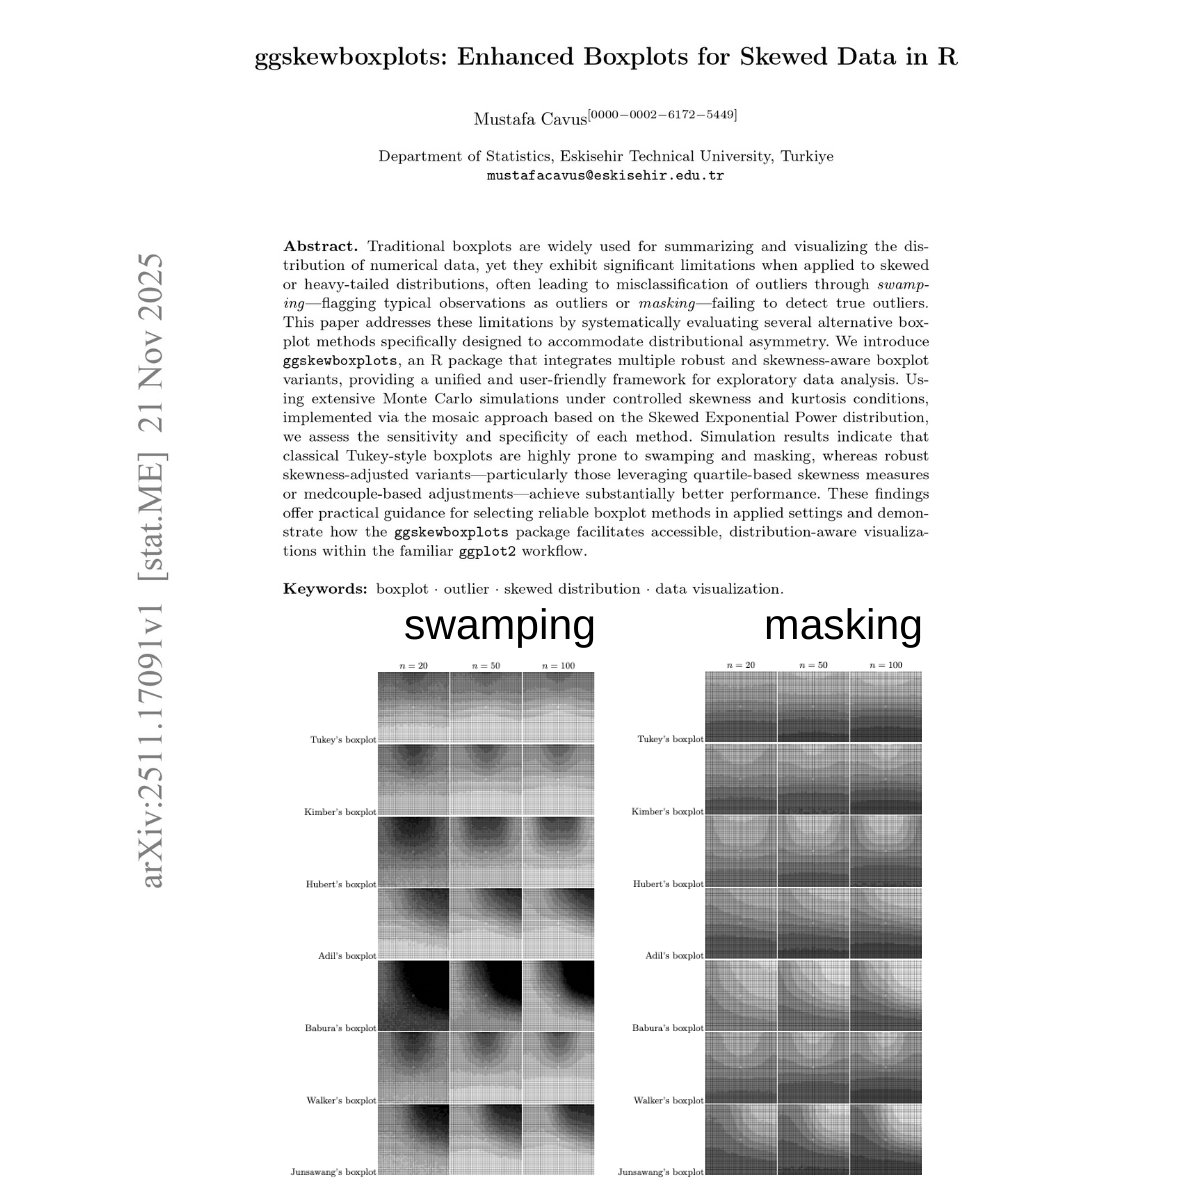
Still using #boxplot for #outlier detection without considering data distribution?
Tukey boxplot can mislead when data is skewed:
Swamping → normal points flagged as outliers
Masking → real outliers hidden
I created an R package for solving this problem!
Let's check it out 👇
The Center and Variability simulation allows students to explore mean, median, range, Interquartile Range, and measures of spread by interacting with different kickers’ unique data distributions from kicks. #boxPlot#distributions
#EARLISIG3 conference on #ConceptualChange in Zwolle is starting today. Happy to be here and discuss our ideas and study about specific source for errors when comparing #Boxplot representation.
UQ_RUG The University of Queensland R Users Group@UQ_RUG
Today we had a great @UQ_RUG session with lots of different issues ranging from 'how do I use a function in a script in another script?' to releveling factors using the #forcats package.
Always learn something new at these sessions!
#R#RStats#Coding#CodingNewbies
Today we had a great @UQ_RUG session with lots of different issues ranging from 'how do I use a function in a script in another script?' to releveling factors using the #forcats package.
Always learn something new at these sessions!
#R#RStats#Coding#CodingNewbies
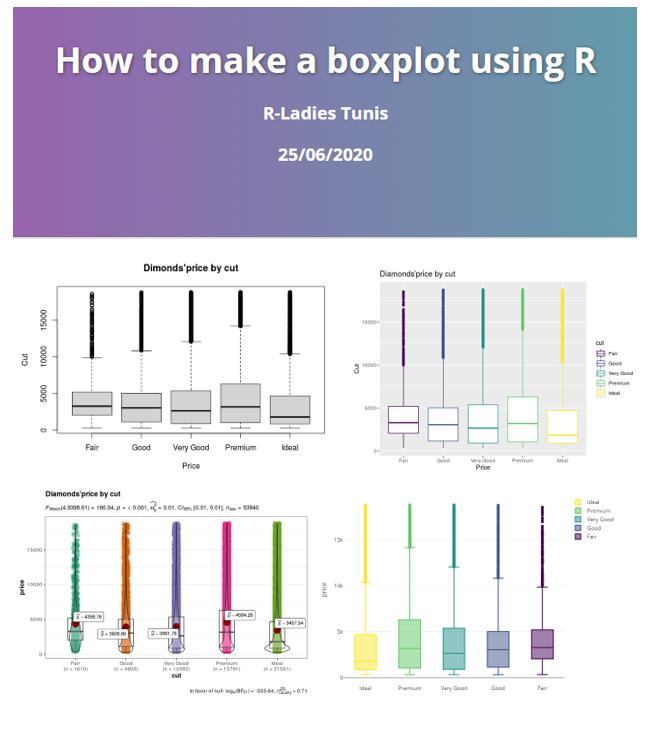
I have just released a video on using RStudio to demonstrate generating boxplots with ggplot library.
The link is as follows:
To access the codes (scripts), check the GitHub link in the description section of the video.
#rstudio#ggplot2#boxplot