#spatialtranscriptomics içeren gönderiler

#spatialtranscriptomics

X'te #spatialtranscriptomics kullanan herkese açık gönderiler.

İlgili etiketler

  1. Brant Bassam✓@BrantBassamPhD
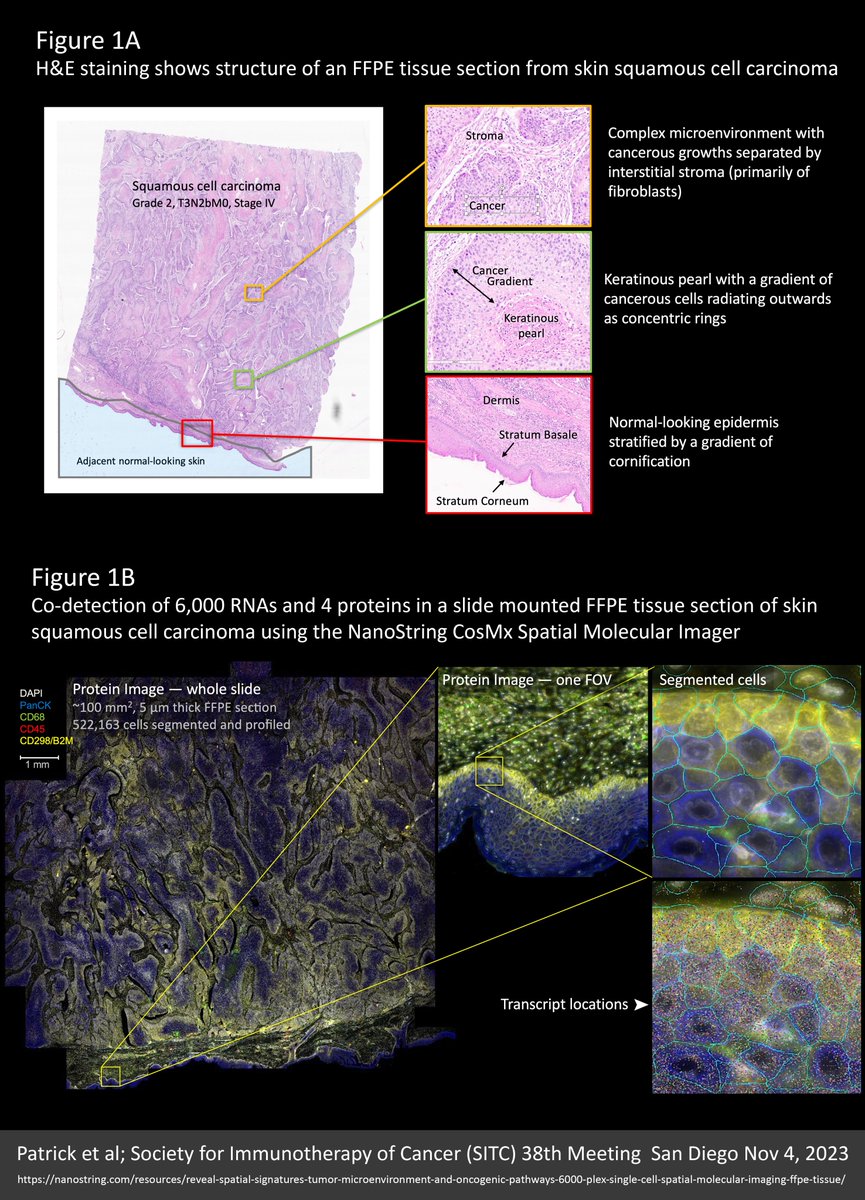
    We’re all wondering what the future of #spatialtranscriptomics (ST) has in store. Well, I think the near future will look a lot like the new 6000-plex dataset reviewed here (link to the original source at the end of this post). SAMPLE An entire 100 mm² intact 5 µm FFPE section from a skin squamous cell carcinoma was profiled for 6,000 unique RNA targets plus four protein markers (CD298/B2M, CD45, PanCK, CD68) and DAPI for nuclear staining using the NanoString CosMx Spatial Molecular Imager. Altogether, over half a million cells were profiled, segmented, and analysed from billions of mapped molecule coordinates. With this particular cancer sample, the skin surface looked normal but the underlying tumour structure was complex. See Figure 1A for imagery and further detail. Note in Figure 1B how protein markers are critical to defining accurate cell boundaries for segmentation and plotted transcripts underscore the super density of this dataset. OPTICAL CROWDING A common pain-point in the ongoing debate over the relative merits of the $NSTG NanoString CosMx and $TXG 10X Genomics Xenium molecule-mapping ST platforms, is the anguish in avoiding “optical crowding” and saturating the “signal space” with either too many targets, higher expressing targets, or both. I only discovered these terms following 10x Xenium discussions; they were never part of the NanoString lexicon. With this dataset we see why: Most of the cells surveyed contained over 2,500 transcripts and some mapped up to 5,000 transcripts per cell, yet there is no evidence of overcrowding. What’s more, these very high counts were obtained from accurately segmented cells that are typically 300-400% smaller than you obtain when similar cells are segmented using the Xenium “expansion” method, detailed in my recent X post reviewing data from the lab of Dr Yutaka Suzuki at University of Tokyo. Figure 2 from that previous X post is reproduced below. This only makes this 6000-plex dataset 300-400% more impressive! See Figure 3A for transcript density plots cor this skin carcinoma sample. NEGATIVE CONTROLS Another discussion point is negative controls and the smoke and mirrors of “false discovery”. Note that negative controls vary across the tissue relative to the density of the cellular matrix (Figure 3A). This is simply because individual molecules are “sticky” and the more cellular matrix available the more get stuck, such that a distribution plot of negative control counts/cell (in Figure 3A) recapitulates a detailed image of the tissue structure. That said, counts are very low (less than a total of 4 per cell from the 10 separate negative controls included in the assay). CELL TYPING A UMAP dimensional reduction plot of cell types shows a predominance of fibroblasts, keratinocytes, and macrophages. On the cancer side, a distinctive “keratinous pearl” cell type and at least eight separate but interrelated cancer subtypes are evident (Figure 3B). A niche analysis beautifully resolves seven intricately detailed spatial population clusters, emphasizing the complexity of this carcinoma (Figure 3B). CELL TYPE VERIFICATION Super density ST data (thousands of targets and thousands of transcripts per cell) allows for greater certainty and nuance in cell typing. This is underlined by the multitude of cancer type variants and the fine gradation between them. Accurate cell typing was confirmed by how well the spatial distribution of cell types corresponded with orthogonal data from H&E images, marker genes that most differentiate groups of cells, and alignment with protein stains. Figure 4A demonstrates colocalization of cell types, marker genes, and stained proteins for three major cell types. NEW BIOLOGY Interestingly, a gradation of cancer cell types was found to radiate in clearly defined rings around keratinous pearl cell core structures. These cancer subpopulations resolved from cells that lack any defining marker gene (Figure 4B). CONCLUSIONS Unsurprisingly, higher plex assays generate more biological insight and greater spatial detail. Kilo-plex assays will be an expectation. Assays need a protein information layer. This also will be an expectation. Not only is this critical for accurate cell segmentation (where inaccuracies contribute the most noise and obfuscation of results) but also for biological insight and orthogonal multiomic validation. The trend will be to higher and higher plex same-cell protein data that digitally overlays the RNA layer. I’m so very excited by this new wave of spatial transcriptomics (ST) technologies. They will not only massively expand biological insight but also our appreciation for the exquisite beauty of multicellular organisation. Find the original Poster publication for this NanoString 6000-plex dataset here: @AlbertVilella @BlauerPlums @lee_spraggon @NeBanovich @ArpitaBKulkarni @GenomicsCow @aruthak @GESTALT_sp @HumphreysLab @DavidPCook @DrJasPlummer @TheGregoryLab @m_mohenska @kirkbjensen @nikhil_seq @Kellieiswise @pinkney_holly @ioavlachos @rkhyip @LGMartelotto
    İndir
    53014630.7K
  2. Hao Yin✓@HaoYin20
    Comparing single-cell #SpatialTranscriptomics methods on FFPE human tumor #TissueMicroArray CosMx 1k vs MERFISH 500 vs Xenium-UM/-MM 339 93 common genes lung adenocarcinoma pleural mesothelioma Corr. Bulk RNAseq, GeoMx "better F1-scores with Xenium-MM (median, > 75%) than other ST platforms for all cell types" @kchenken @NatureComms 2025
    İndir
    02911110.8K
  3. Jennifer Young@nano_jenn
    Excited to share our lab's new preprint led by Ting @huanting_ong introducing paired-surface spatial mechanomics! We link nanoindentation stiffness maps with #SpatialTranscriptomics to connect local tissue mechanics with molecular state. 🔗 🧵1/7
    İndir
    6241036.6K
  4. Simona Cristea✓@simocristea
    🚨New #SpatialTranscriptomics #Bioinformatics data resource out in @naturemethods. SODB, a platform with >2,400 manually curated spatial experiments from >25 spatial omics technologies & interactive analytical modules. This🧵will walk you through all the features of SODB [1/33]
    İndir
    28931142.2K
  5. Hao Yin✓@HaoYin20
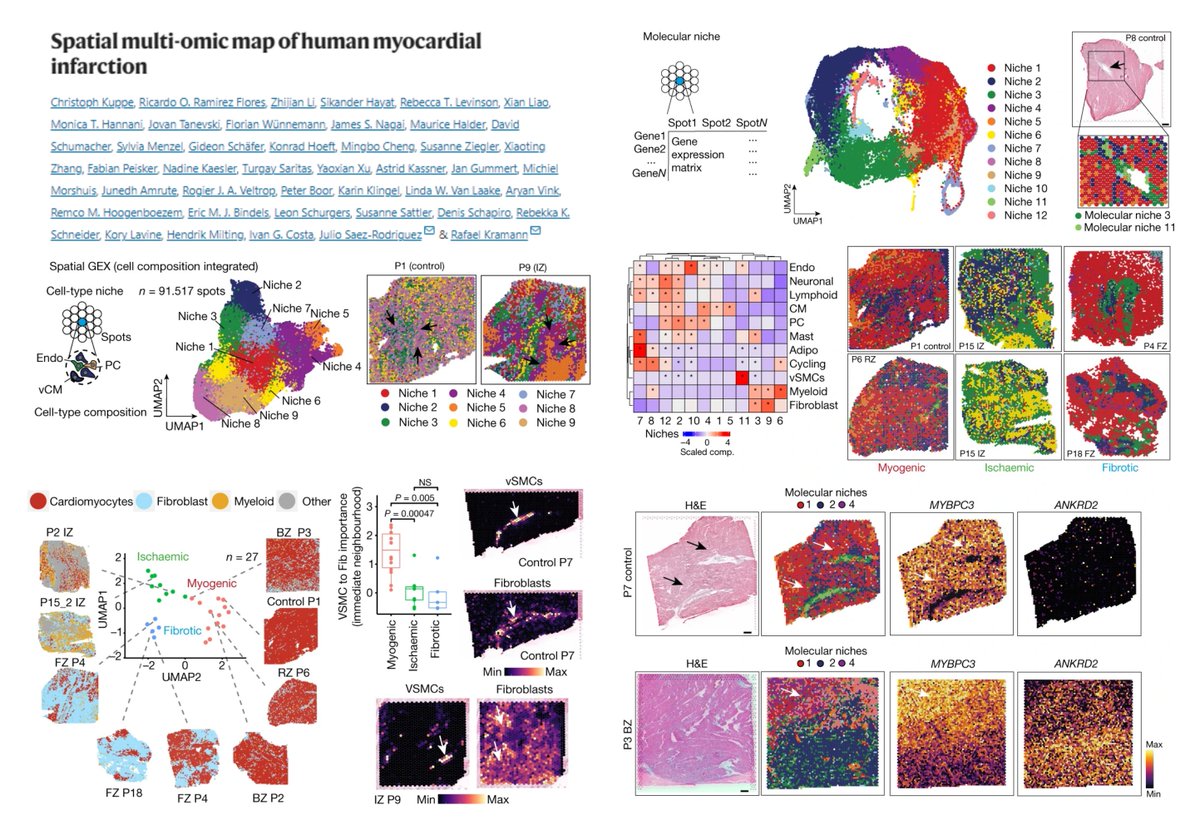
    Spatial multi-omic map of human #MyocardialInfarction snATACseq snRNAseq #SpatialTranscriptomics Visium 19 case + 4 ctrl A brilliant model paper for spatial niche analysis Enhancer-based gene regulatory network-> 3 spatially-definable #Cardiomyocyte states NR3C2+RXRG+ (non-stressed) MEF2D+IRF1+ (pre-stressed) ATF3+FOSL1/2+ (stressed, located in injured area & surrounding large blood vessels!😍) (2 more CM states in Fig 4a?😃) Any regenerative, dedifferentiated or proliferative traits in cardiomyocytes?😆 @KuppeChristoph @JulioSaezRod @rkramann @Nature 2022
    İndir
    23915820.4K
  6. Dr. Jean Fan@JEFworks
    Check out our just published SEraster tool for aggregating #SingleCell #SpatialTranscriptomics data into square/hex pixels for scalable spatial #DataAnalysis. Paper: Software: #RStats Congrats to @Gohta_Aihara + team 🥂 See 🧵👇
    Gohta Aihara @Gohta_Aihara
    Having trouble analyzing large-scale #spatialomics data? SEraster, a rasterization preprocessing framework on #Rstats that aggregates cellular information into spatial pixels for scalable analysis, is now published on Bioinformatics! Paper: 🧵👇 1/n
    013578.5K
  7. Gohta Aihara@Gohta_Aihara
    Having trouble analyzing large-scale #spatialomics data? SEraster, a rasterization preprocessing framework on #Rstats that aggregates cellular information into spatial pixels for scalable analysis, is now published on Bioinformatics! Paper: 🧵👇 1/n
    İndir
    2104711.8K
  8. Emilia Favuzzi@emiliafavuzzi
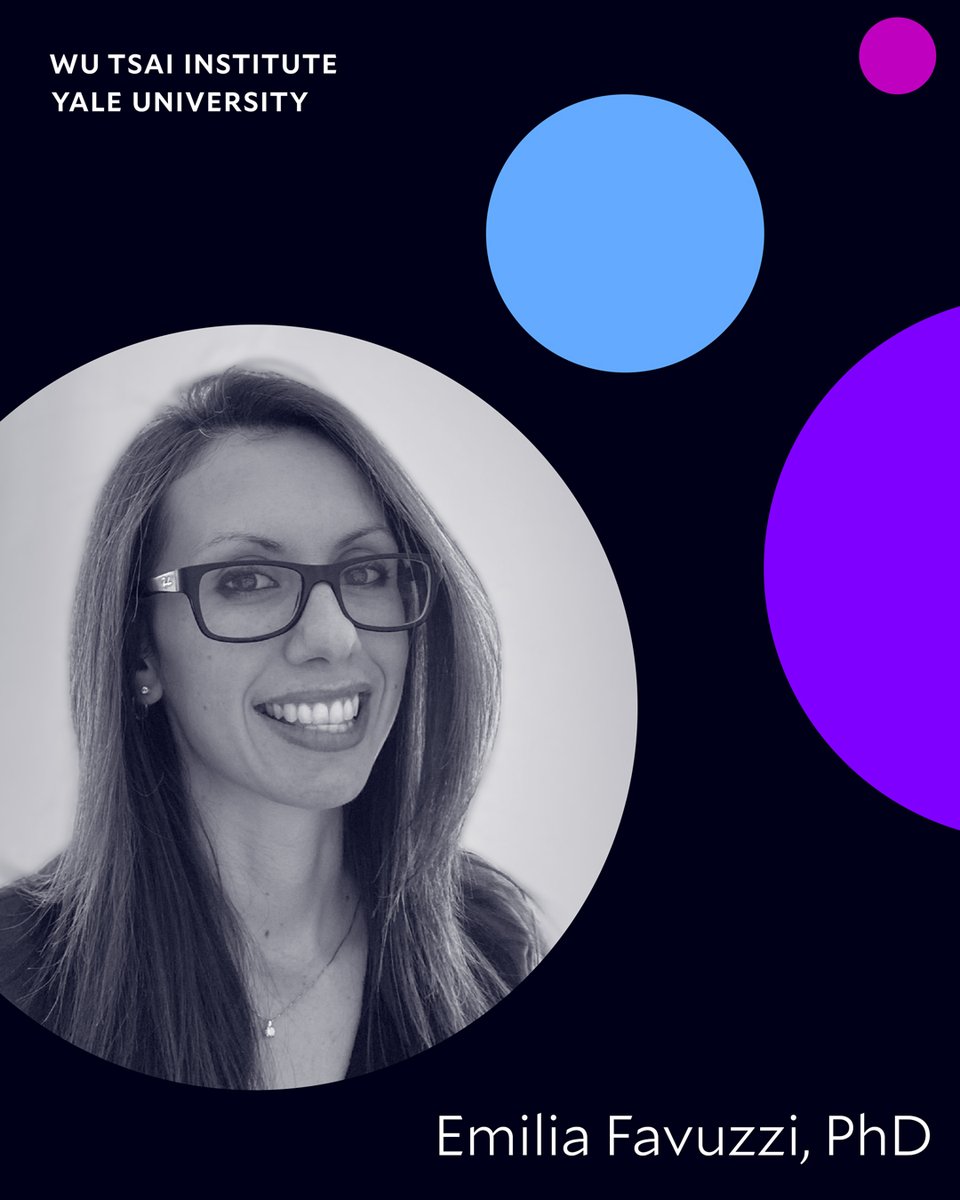
    I am beyond excited to open my lab this Fall 2022 @WuTsaiYale & @YaleNeuro @YaleMed. We will study neuroimmune interactions and brain wiring (including #microglia) by combining in vivo imaging and molecular approaches (#Spatialtranscriptomics) in mouse models. #newPI 🧵
    Wu Tsai Institute | Yale University @WuTsaiYale
    The Wu Tsai Institute is excited to welcome Emilia Favuzzi, PhD, joining us next year as an Assistant Professor in the Department of Neuroscience and our first WTI Investigator! #HumansOfWTI #KnowTogether #Neuroscience #YaleScience @YaleMed @YaleNeuro @emiliafavuzzi
    4320345
  9. Hao Yin✓@HaoYin20
    #Bin2cell reconstructs cells from high resolution #VisiumHD data #SpatialTranscriptomics Transforming #VisiumHD matrix into Single-Cell Spatial data😎 using 2 μm bins (instead of 8 μm) & StarDist segmentation (H&E Nuclei detection + expansion + fluorescence model-based salvage secondary segmentation when nuclei are undetectable/of unusual shape) Outperforming standard 8-μm-bin data on single cell type annotation & neighborhood identification on mouse brain (Ground truth: 550-gene MERFISH, Zhang, Nature 2023), human colorectal cancer CellTypist confidence score @teichlab @YayonNadav bioRxiv 2024
    İndir
    1278811.1K
  10. Hao Yin✓@HaoYin20
    #VisiumHD #SpatialTranscriptomics #ColorectalCancer FFPE sections Continuous 2-µm matrix 8-µm binned data "deconvolution based on single cell data and assignment of uniform labels is useful for performing comparisons between samples" 2-µm bins assigned to nuclei polygon▶️gene by nuclei UMI matrix "Reanalyzing the data in this region using higher resolution (2 µm bins), enabled us to improve our capacity to identify T cells within the TME, since many were lost due to their small size and colocalization with other cells at 8 µm resolution" @10xGenomics bioRxiv 2024
    İndir
    014665.3K
  11. Hao Yin✓@HaoYin20
    Systematic comparison of 11 sequencing-based #SpatialTranscriptomics methods A must-read for spatial omics researchers🤠 Visium DynaSpatial HDST BMKMANU S1000 Slide-seq V2 Curio Seeker Slide-tag Stereo-seq PIXEL-seq Salus DBiT-seq Guess which behaves best for🧠microvasculature?😁 A standard benchmarking pipeline ▶️Molecule-capture efficiency (per unit area) ▶️Molecule lateral diffusion ▶️Clustering/Cell annotation (Seurat still outperforms or PRECAST😯) ▶️Marker gene detection ▶️Cell-to-cell communication (no consistent results found) 💰Fig 4f Affordability Xiaodong Liu & Luyi Tian labs @naturemethods 2024 @ethanxdliu @Luyi_T + cadasSTre, a website for raw/processed data #OpenScience
    İndir
    28629444.7K
  12. Daha fazla gönderi göster