$IRBT
Is iRobot about to double? 🤔👀
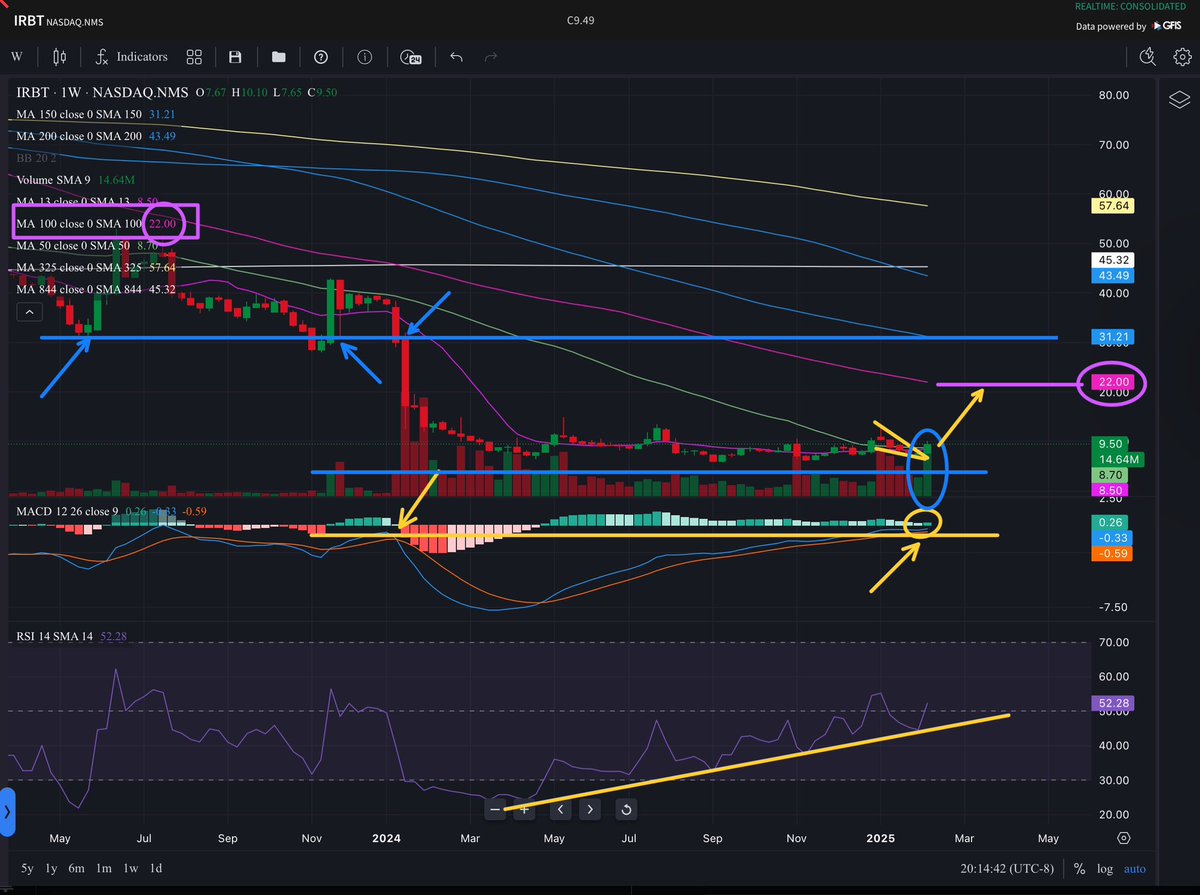
IRBT - weekly chart analysis 💛
My target for this chart is 🎯$20 😳
It’s the first time in a long time that we have close above the 50SMA (Simple Moving Avg) weekly! 🧐
The weekly 50SMA is a usually a strong indication of whether a stock simply put is bullish or bearish. The 50SMA is olive green moving average that is right where price is, and if you follow it up with your eyes to the left you can see that ever since the stock broke below the 50SMA weekly, what the negative price action has been like since
IRBT just broke out of a weekly descending wedge which is a bullish pattern and it did so on heavy volume
So, it broke above the Weekly 50SMA, it broke above a weekly descending wedge, it did all of that on heavy volume, and MACD is already above where price last coincided in the 🎯$30 DOLLAR RANGE 👀👀👀- right at the 150 SMA
But first things first, that’s why I’m targeting the next range of supply since the 50SMA is reclaimed, the “good book” says we test the 100SMA at 🎯$22 DOLLARS
Not financial advice!
Not financial advice!
186228145K