Day 6 of the #30DayChartChallenge: experimental comparisons. Today, we revisit Lindsay Platt’s experimental #streamgraph#dataviz comparing #flood durations at multiple #rivers since 2000. Notably, the James River in #SouthDakota endured a 534-day long flood that ended last Sept
Hello! I made a #streamgraph on U.S. crop yield over the last 50 years.
TLDR: The U.S. is increasing and diversifying the fruit crop in the last 10 years.
#datajournalism
Tried a #Streamgraph for a recent #MakeoverMonday (Thanks to @ltavernier7 for the instructions & @RodyZakovich for coming up with a bunch of formulas in the first place).
The analytical value is rather limited but I'm happy I got it to work!
My long-term-project - Women in polish comic scene. I use data from two comic websites which, aghr, I have to reshape manually. Below #streamgraph ‘with’ people whose surnames start with A-C letters. I didn’t realize there were so many people... #dataviz#rstudio
Wordstream combines the features of a word cloud and a stream graph, taking advantage of the streamgraph's ability to highlight continuous horizontal layers and accommodate numerous categories.
#dataviz#wordcloud#streamgraph@NortheasternCA
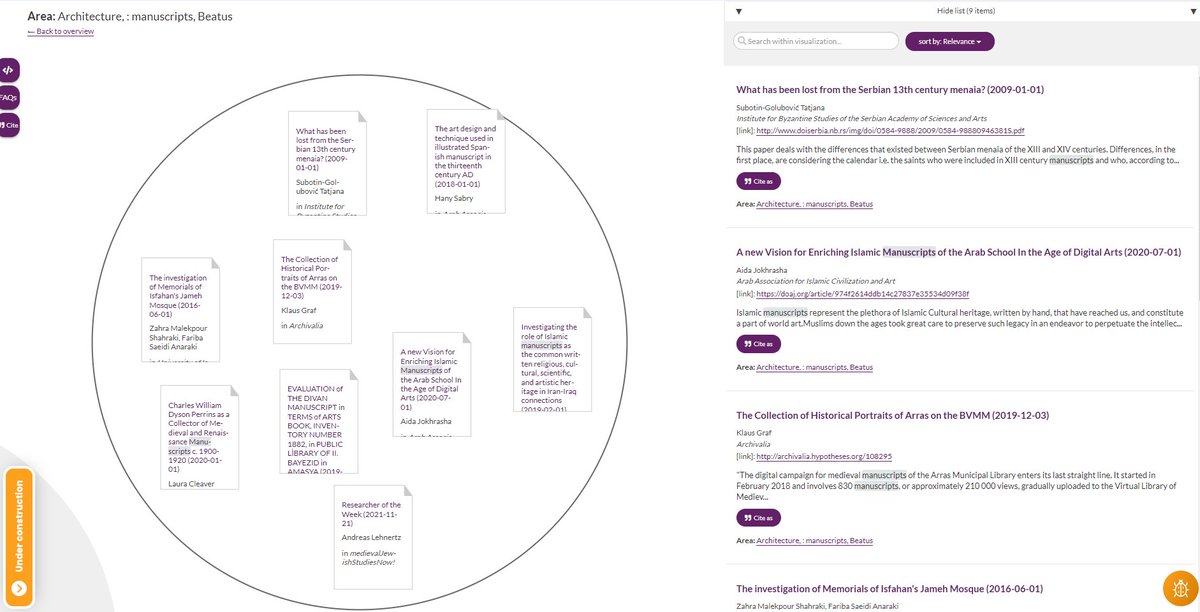
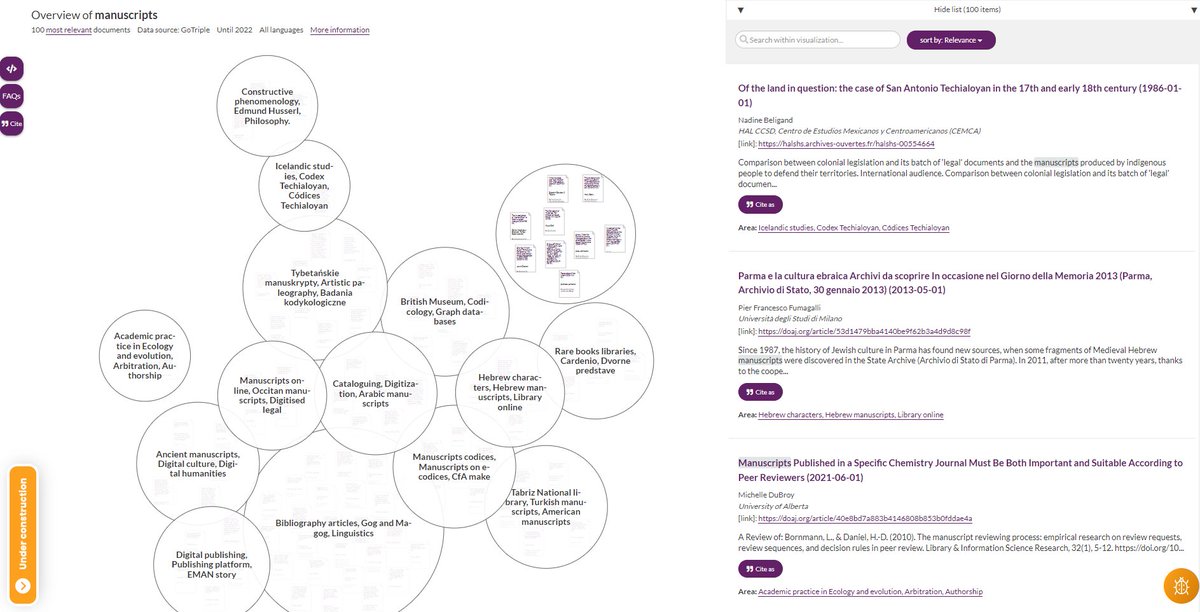
1.1 GoTriple offers two options to #visualize the results of your query. Firstly, the #knowledgemap: The map provides you with a #topical overview for your search query based on the 100 most relevant documents matching your query.
1.2 Secondly, the #Streamgraph, that presents you with an overview of the main #keywords connected to the term you searched for and provides you with information how they evolved over time.
‼️Gráfico de flujo o #streamgraph se utiliza para representar la evolución de frecuencias a través de áreas apiladas
👉 Una de sus principales características es la fluidez de las diferentes capas
👉 Cada capa suele ir representada de un color
👉 Sólo permite valores positivos
Share
Copied
Alli Torban@AlliTorban
many years ago, @CarniDC shared his career path as a stream graph, and I've always wanted to do my own!
you can see how having kids squeezed everything else out for a while, but I'm back baby with my own #DataViz studio!💪
many years ago, @CarniDC shared his career path as a stream graph, and I've always wanted to do my own!
you can see how having kids squeezed everything else out for a while, but I'm back baby with my own #DataViz studio!💪