Posts with #spatialTranscriptomics

#spatialTranscriptomics

Public posts on X that use #spatialTranscriptomics.

Related hashtags

  1. Hao Yin✓@HaoYin20
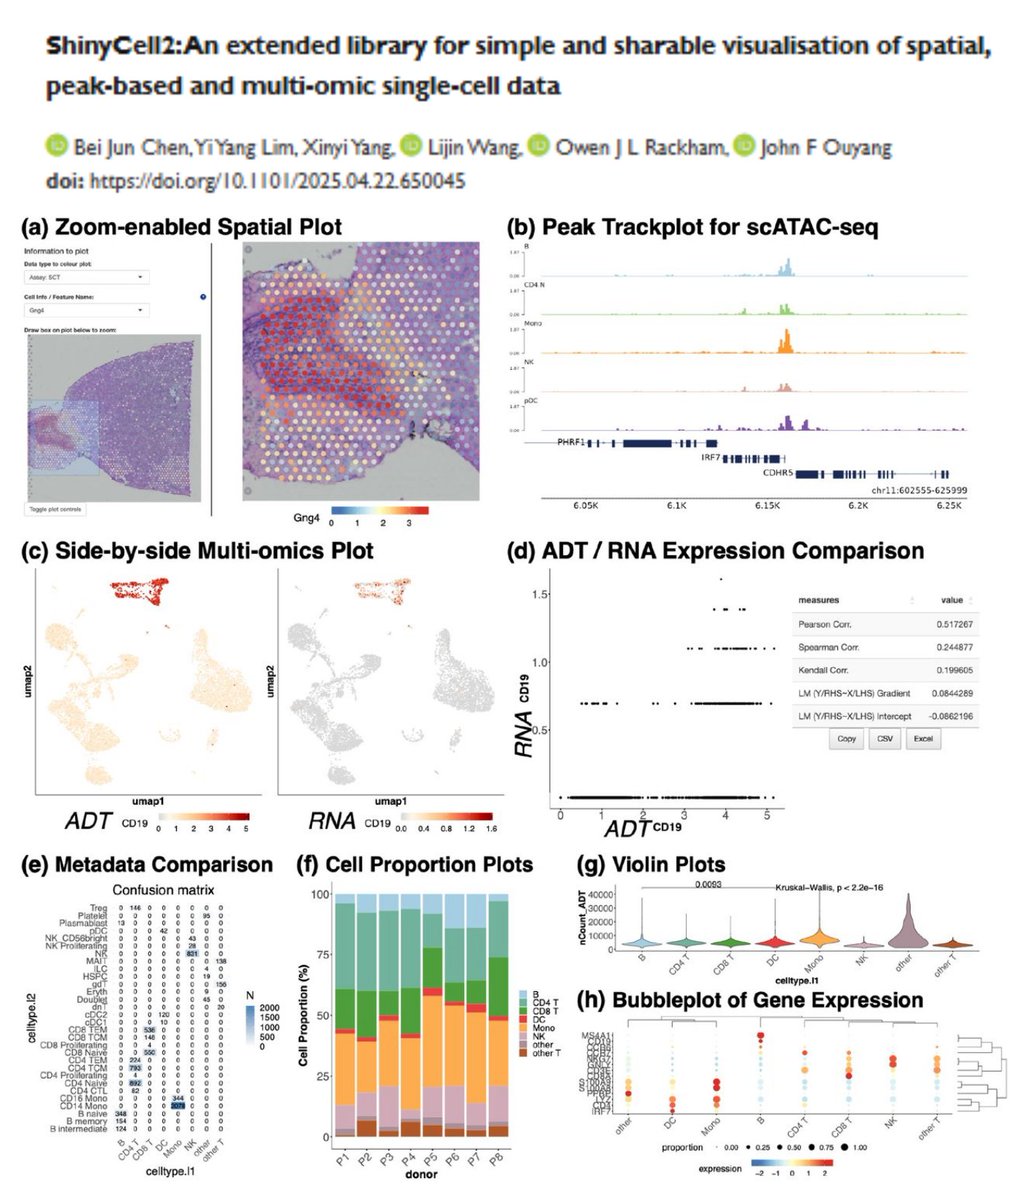
    Want to visualize & create a website for your omics data (+CITEseq scATACseq #SpatialTranscriptomics)? Try ShinyCell2!😆 Compatible with data formats Seurat Signac ArchR Scanpy (other formats converted by sceasy) (also imaging-based ST data?😁) vs cellxgene WebAtlas Vitessce @OwenRackham @imouyang bioRxiv 2024
    Download
    211683.8K
  2. Hao Yin✓@HaoYin20
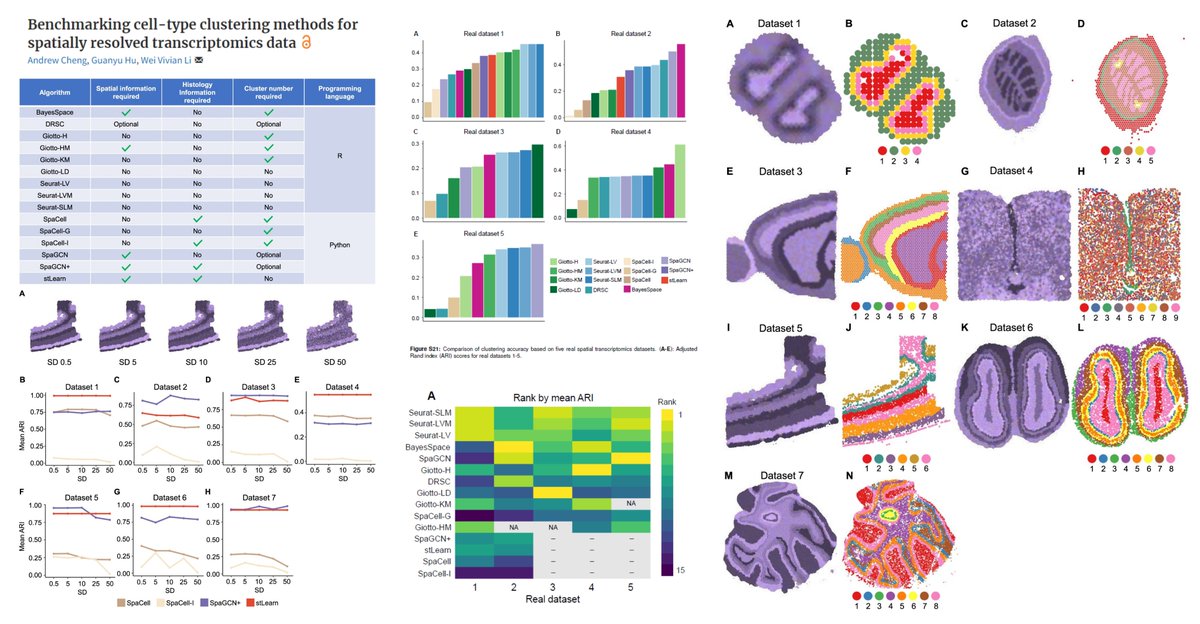
    Benchmarking cell-type clustering methods for #SpatialTranscriptomics data 7 packages, 15 methods -/+ Histology images BayesSpace Giotto Seurat SpaCell SpaGCN stLearn Clustering accuracy #AdjustedRandIndex Robustness to 1⃣Sequencing depth 2⃣Predefined cluster number 3⃣Color variation of histology images Seurat methods are among those of best performance, even Without spatial/histology info🥸 "incorporating spatial or histology information does not guarantee to improve clustering robustness in existing method" ➡️Guess we will have better spatially aware ST analysis methods @vivianstats @BriefingBioinfo 2023
    Download
    12811018K
  3. Brant Bassam✓@BrantBassamPhD
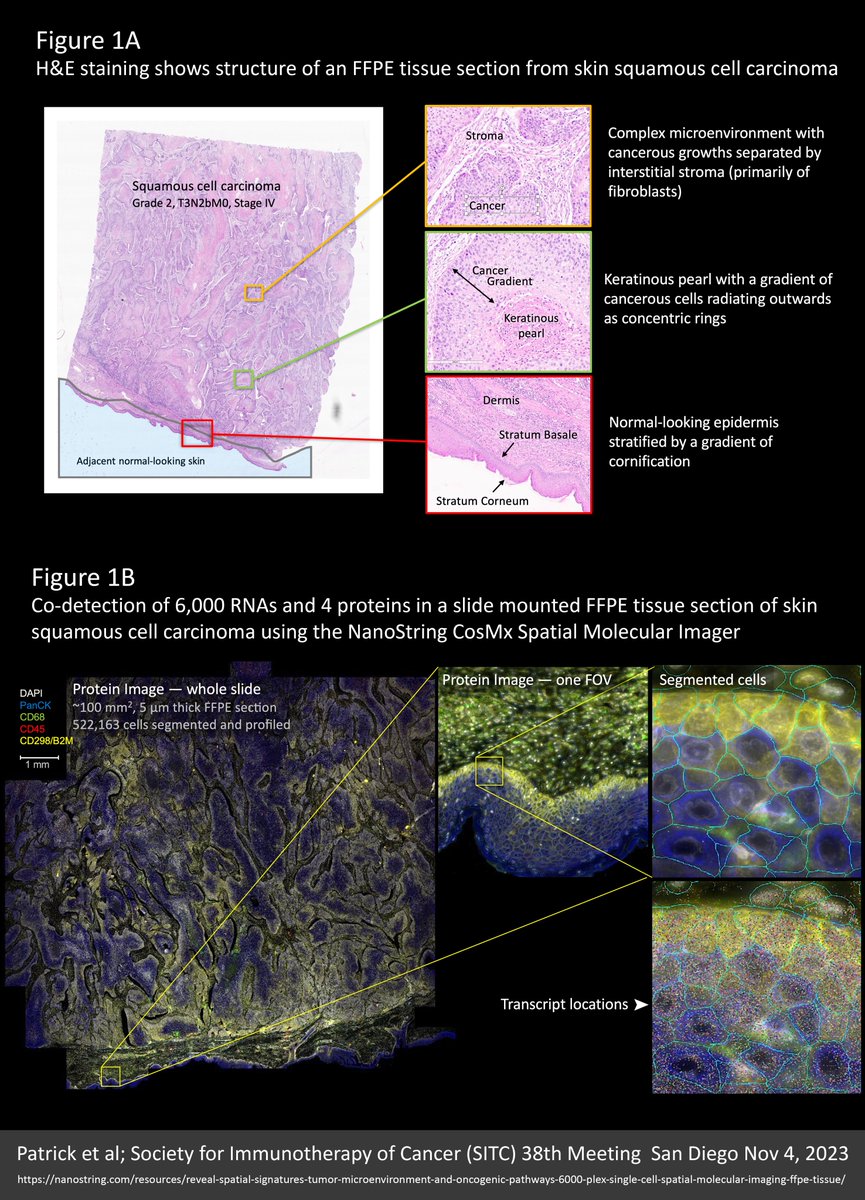
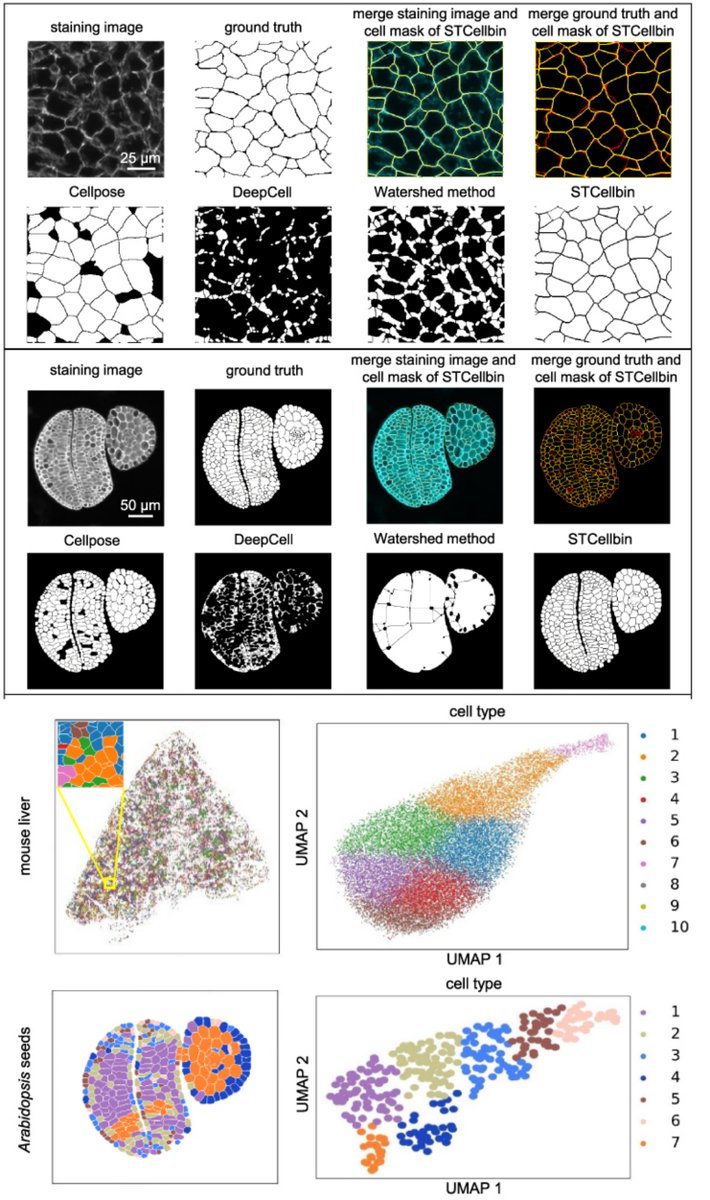
    We’re all wondering what the future of #spatialtranscriptomics (ST) has in store. Well, I think the near future will look a lot like the new 6000-plex dataset reviewed here (link to the original source at the end of this post). SAMPLE An entire 100 mm² intact 5 µm FFPE section from a skin squamous cell carcinoma was profiled for 6,000 unique RNA targets plus four protein markers (CD298/B2M, CD45, PanCK, CD68) and DAPI for nuclear staining using the NanoString CosMx Spatial Molecular Imager. Altogether, over half a million cells were profiled, segmented, and analysed from billions of mapped molecule coordinates. With this particular cancer sample, the skin surface looked normal but the underlying tumour structure was complex. See Figure 1A for imagery and further detail. Note in Figure 1B how protein markers are critical to defining accurate cell boundaries for segmentation and plotted transcripts underscore the super density of this dataset. OPTICAL CROWDING A common pain-point in the ongoing debate over the relative merits of the $NSTG NanoString CosMx and $TXG 10X Genomics Xenium molecule-mapping ST platforms, is the anguish in avoiding “optical crowding” and saturating the “signal space” with either too many targets, higher expressing targets, or both. I only discovered these terms following 10x Xenium discussions; they were never part of the NanoString lexicon. With this dataset we see why: Most of the cells surveyed contained over 2,500 transcripts and some mapped up to 5,000 transcripts per cell, yet there is no evidence of overcrowding. What’s more, these very high counts were obtained from accurately segmented cells that are typically 300-400% smaller than you obtain when similar cells are segmented using the Xenium “expansion” method, detailed in my recent X post reviewing data from the lab of Dr Yutaka Suzuki at University of Tokyo. Figure 2 from that previous X post is reproduced below. This only makes this 6000-plex dataset 300-400% more impressive! See Figure 3A for transcript density plots cor this skin carcinoma sample. NEGATIVE CONTROLS Another discussion point is negative controls and the smoke and mirrors of “false discovery”. Note that negative controls vary across the tissue relative to the density of the cellular matrix (Figure 3A). This is simply because individual molecules are “sticky” and the more cellular matrix available the more get stuck, such that a distribution plot of negative control counts/cell (in Figure 3A) recapitulates a detailed image of the tissue structure. That said, counts are very low (less than a total of 4 per cell from the 10 separate negative controls included in the assay). CELL TYPING A UMAP dimensional reduction plot of cell types shows a predominance of fibroblasts, keratinocytes, and macrophages. On the cancer side, a distinctive “keratinous pearl” cell type and at least eight separate but interrelated cancer subtypes are evident (Figure 3B). A niche analysis beautifully resolves seven intricately detailed spatial population clusters, emphasizing the complexity of this carcinoma (Figure 3B). CELL TYPE VERIFICATION Super density ST data (thousands of targets and thousands of transcripts per cell) allows for greater certainty and nuance in cell typing. This is underlined by the multitude of cancer type variants and the fine gradation between them. Accurate cell typing was confirmed by how well the spatial distribution of cell types corresponded with orthogonal data from H&E images, marker genes that most differentiate groups of cells, and alignment with protein stains. Figure 4A demonstrates colocalization of cell types, marker genes, and stained proteins for three major cell types. NEW BIOLOGY Interestingly, a gradation of cancer cell types was found to radiate in clearly defined rings around keratinous pearl cell core structures. These cancer subpopulations resolved from cells that lack any defining marker gene (Figure 4B). CONCLUSIONS Unsurprisingly, higher plex assays generate more biological insight and greater spatial detail. Kilo-plex assays will be an expectation. Assays need a protein information layer. This also will be an expectation. Not only is this critical for accurate cell segmentation (where inaccuracies contribute the most noise and obfuscation of results) but also for biological insight and orthogonal multiomic validation. The trend will be to higher and higher plex same-cell protein data that digitally overlays the RNA layer. I’m so very excited by this new wave of spatial transcriptomics (ST) technologies. They will not only massively expand biological insight but also our appreciation for the exquisite beauty of multicellular organisation. Find the original Poster publication for this NanoString 6000-plex dataset here: @AlbertVilella @BlauerPlums @lee_spraggon @NeBanovich @ArpitaBKulkarni @GenomicsCow @aruthak @GESTALT_sp @HumphreysLab @DavidPCook @DrJasPlummer @TheGregoryLab @m_mohenska @kirkbjensen @nikhil_seq @Kellieiswise @pinkney_holly @ioavlachos @rkhyip @LGMartelotto
    Download
    53014630.7K
  4. Hao Yin✓@HaoYin20
    Single-cell #SpatialTranscriptomics 👤#Atherosclerosis🤩🤩 Xenium @10xGenomics (314 cell marker genes + 345 athero disease genes) 4 early carotid lesions + 12 advanced lesions Baysor 10 μm▶️Cell segmentation squidy▶️100 μm radius Neighbourhood▶️ >20 #EndothelialCell #SmoothMuscleCell Mφ neighbourhood clusters▶️ (Co-)Localization of neighbourhoods may re-categorize plaques How was the distance to lumen recalculated?🧐 How do these neighbourhoods cross-talk with each other?😁 Will this spatial neighbourhood clustering infer druggable targets?🤓 Lars Maegdefessel lab bioRxiv 2025 @Jessica_Pauli_
    Download
    110423.3K
  5. Hao Yin✓@HaoYin20
    How many ways to integrate single-cell & #SpatialTranscriptomics😁 16 methods +45 datasets Tangram gimVI SpaGE Seurat SpaOTsc novoSpaRc LIGER stPlus Cell2location SpatialDWLS RCTD Stereoscope DestVI STRIDE SPOTlight DSTG Dr Kun Qu lab @naturemethods 2022
    Download
    18123753.5K
  6. Hao Yin✓@HaoYin20
    3D #SpatialTranscriptomics Whole cardiomyocyte in adult🐭🫀 10x 10 µm cryosections 3.5 µm BMKMANU S3000 ST chips WGA stain-Cellpose➡️cell boundary Dynamic time warping +Optimal transport +Centroid distance ➡️3D registration 2.7k genes/cell vs 10x VisiumHD, snRNAseq Intracellular RNA asymmetry Mito-metabolism at proximal end Neuronal-like signaling at distal end
    Download
    215775K
  7. Hao Yin✓@HaoYin20
    TransformerST #SpatialTranscriptomics Vision transformer Adaptive graph transformer Cross-scale internal graph network Image-gene co-representation: Gene expression+Spatial coordinates+Histologic images "could achieve super-resolved resolution of a single cell per subspot" w/o scRNAseq reference Note for Lung Microvascular researchers with #VISIUM ✅stLearn SpaGCN TransformerST @BriefingBioinfo 2024 If you are a #SpatialOmics learner like me, this is a particularly useful, timely piece of reading 😀
    Download
    124997.6K
  8. Hao Yin✓@HaoYin20
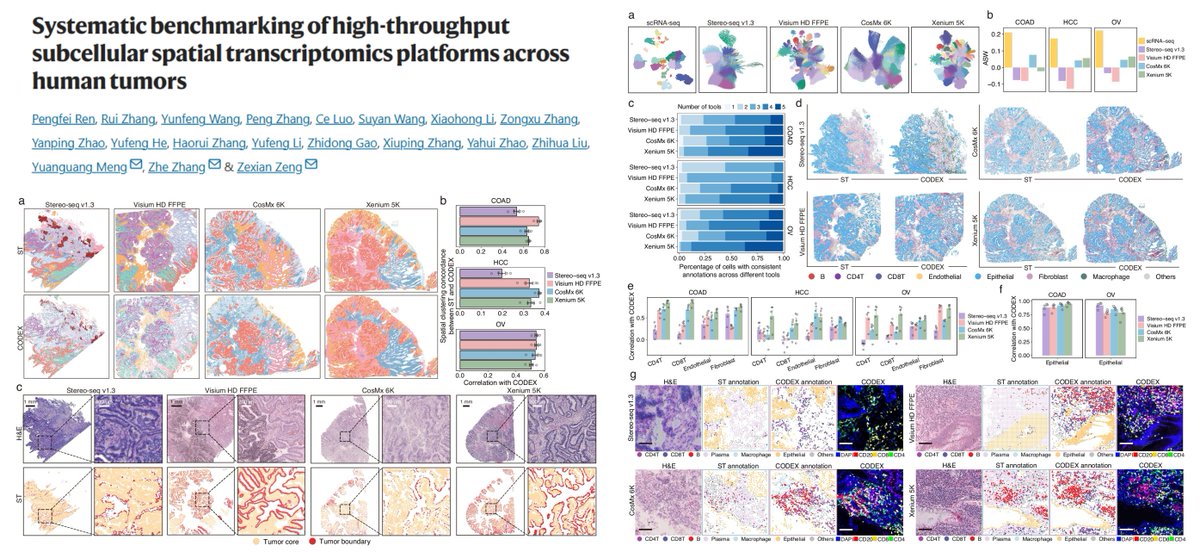
    Systematic comparisons among 4 subcellular-resolution #SpatialTranscriptomics methods Stereo-seq v1.3 Visium HD FFPE CosMx 6k Xenium 5k Human Tumors Ground truth CODEX, +scRNAseq Gene detection sensitivity (CosMx performance...🙁) (Spatial) false positives Transcript-protein correlation Cell segmentation Cell type annotation & spatial alignment to CODEX Spatial clustering Spatial pathway enrichment @NatureComms 2025
    Download
    23314413.7K
  9. Hao Yin✓@HaoYin20
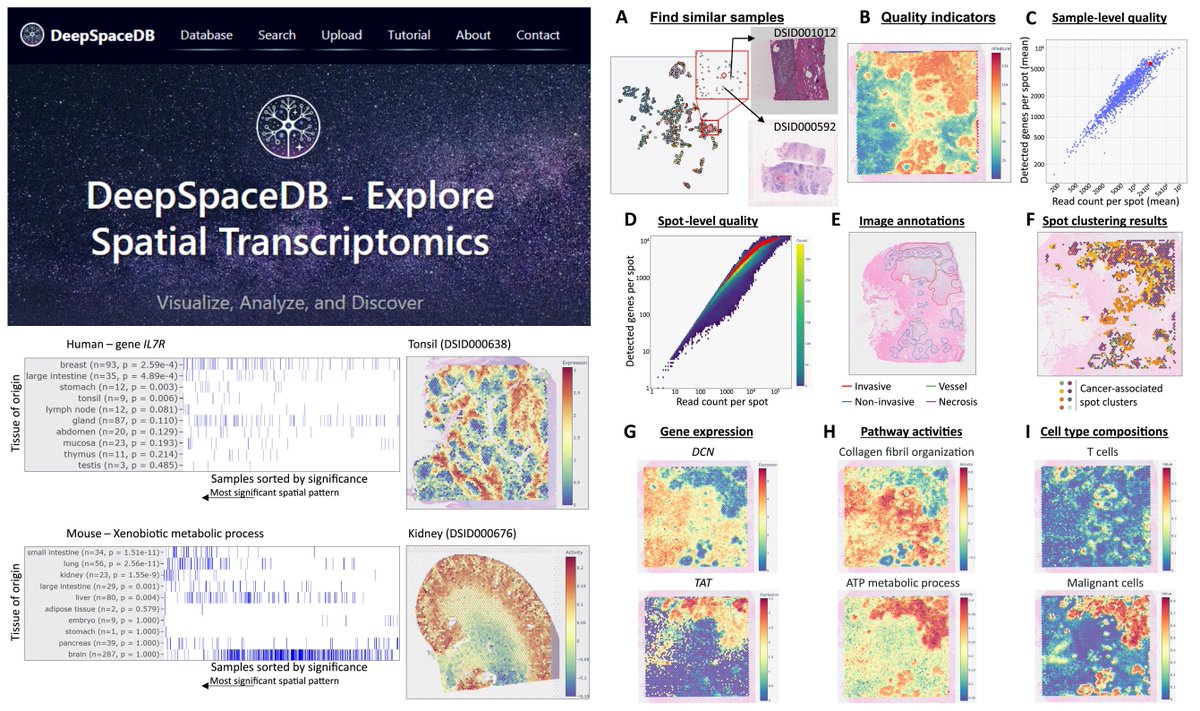
    DeepSpaceDB >2k #SpatialTranscriptomics Visium samples 👉Interactive, downloadable data analysis QC➡️ manual/LLM image annotation➡️ in-sample or cross-sample spot clustering BASS BayesSpace➡️ Spatially variable genes singleCellHaystack SPARK-X binSpect➡️ Cell type deconvolution RCTD SPOTlight 👉Cross-sample/Cross-study comparison 👉Analyze your own data 👉Database-wide gene/pathway inquiry @alexisvdb #NucAcidRes 2026
    Download
    3301319.3K
  10. Hao Yin✓@HaoYin20
    Systematic comparison of 11 sequencing-based #SpatialTranscriptomics methods A must-read for spatial omics researchers🤠 Visium DynaSpatial HDST BMKMANU S1000 Slide-seq V2 Curio Seeker Slide-tag Stereo-seq PIXEL-seq Salus DBiT-seq Guess which behaves best for🧠microvasculature?😁 A standard benchmarking pipeline ▶️Molecule-capture efficiency (per unit area) ▶️Molecule lateral diffusion ▶️Clustering/Cell annotation (Seurat still outperforms or PRECAST😯) ▶️Marker gene detection ▶️Cell-to-cell communication (no consistent results found) 💰Fig 4f Affordability Xiaodong Liu & Luyi Tian labs @naturemethods 2024 @ethanxdliu @Luyi_T + cadasSTre, a website for raw/processed data #OpenScience
    Download
    28629344.7K
  11. Hao Yin✓@HaoYin20
    #CellCharter A powerful single-cell #SpatialTranscriptomics analysis framework Graph-based #DeepLearning Spatial cluster: Cell type Different expression Neighborhood enrichment AND Shape!!!👹 - curl/elongation/linearity/purity #VariationalAutoEncoder for dimension reduction, batch correction & multi-technical platform (CosMx/MERFISH/#ImagingMassSpectrometry)/Multiomic integration Spatially-resolved #LungCancer Hypoxia & Tumore-associated neutrophil signatures->Prognostic values for NSCLC Computationally efficiency->Scalability @MarcoVarrone @loganawalsh @CirielloLab @NatureGenet 2024
    Download
    06018719.2K
  12. Show more posts