Posts with #technicalanalysis

#technicalanalysis

Public posts on X that use #technicalanalysis.

Related hashtags

  1. Sunil Gurjar, CFTe✓@sunilgurjar01
    22 TECHNICAL ANALYSIS TOPICS YOU NEED TO LEARN.📊🎯 Bookmark it.👇🔖 1. Fibonacci Retracements 2.Breakouts 3.Reversal 4.Elliott Wave 5.Fair Value Gap 6.Candlesticks 7.Heikin Ashli 8.Moon Phases 9.Renko 10.Harmonic Patterns 11. Support and resistance 12.Dynamic Support and resistance 13.Trend lines 14.Gann Angles 15.Momentum Indicators 16.Oscillators 17.Divergence 18.Volume 19. Supply &Demand 20. Market Structure 21.BOS 22.CHOCH #trading
    Download
    253771.7K93.8K
  2. Scott Redler✓@RedDogT3
    Take 12 minutes this weekend and review each tactic. Each technical indicator we’ve been using for 25+ years. This is free for u. Better than most college courses!
    Download
    76334130.6K
  3. Rohit Srivastava✓@indiacharts
    Nifty 22,757 breakout confirmed! Trend shifts to Higher Highs! 🚀 🚀 Target 1: 23,160 🎯 Target 2: 23,480 – 23,490 (Upper Black Channel) 🛡 Retest Support Zone: 22,850 – 22,900 Buy-on-dips active inside the new Black Channel! 📊🎯 #Nifty50 #PriceAction #TechnicalAnalysis #StockMarketIndia SEBI Registered RA Indiacharts Data Analytics Pvt. Ltd. | INH000023630
    Download
    3511116.2K
  4. Julian Komar✓@BlogJulianKomar
    Want to sharpen your chart skills? 📊 I’ve recorded step-by-step videos on the exact TA concepts I use daily. Here are my top technical analysis lessons 👇 1. VCP - Volatility Contraction Pattern (Example $TDOC - TELADOC) – 2. How I use moving average in my stock trading in TradingView – 3. How to use the Relative Strength Line (RS Line) for stocks – 4. How to find trading bases in stock charts – 5. How to recognize leading stocks – Each video shows real charts, past winners, and current setups — no theory, just application. Thousands of traders have studied these lessons with me. You can too.
    Download
    185725019.9K
  5. Aryan✓@TraderAryan
    When traders say it took them 3–5 years to figure it out, They are not talking about technical analysis.
    Download
    2656708.6K448K
  6. Mitrade App@MitradeApp
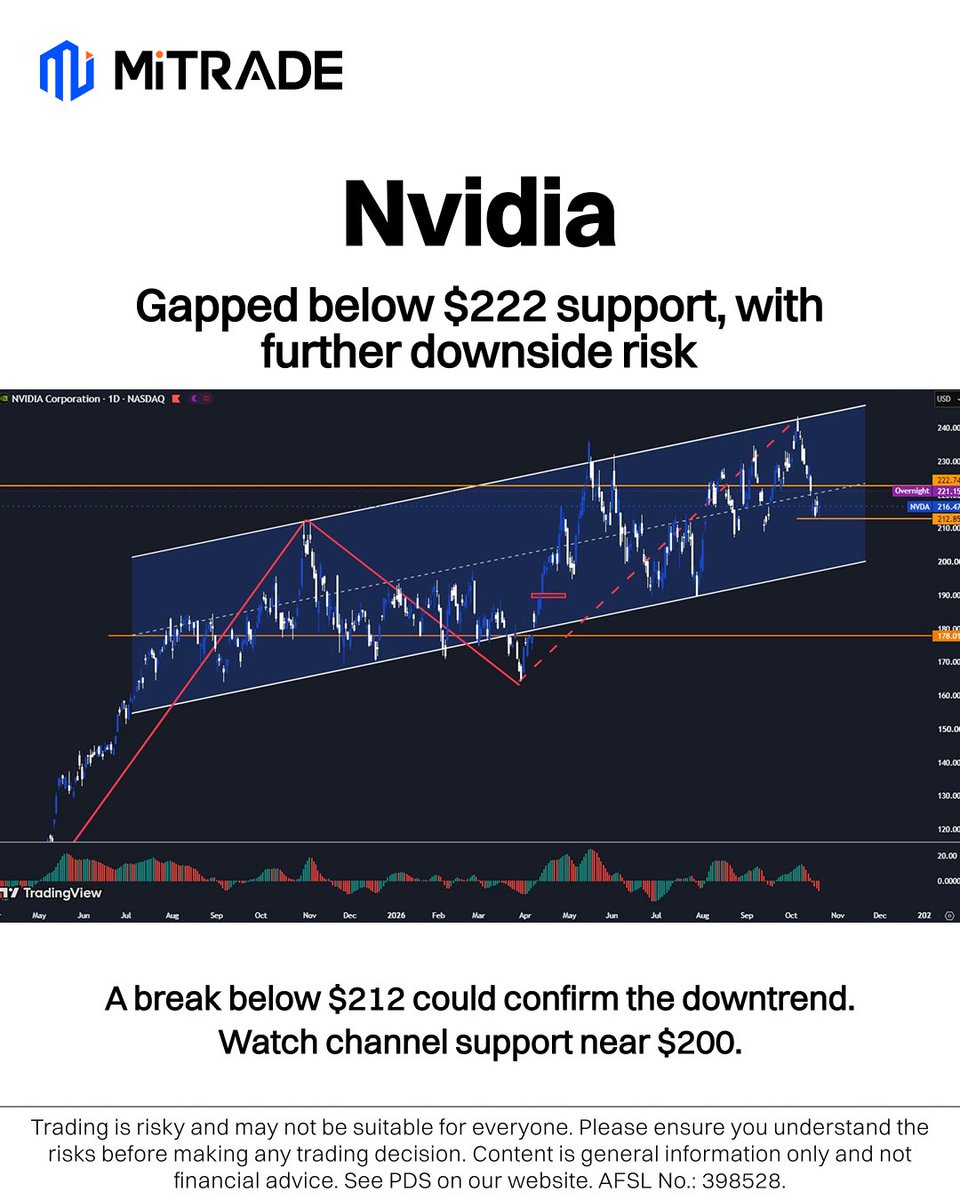
    Nvidia was rejected at its rising-channel top and gapped below $222 support. A break below $212 could confirm a medium-term downtrend, with channel support near $200 and the Apr. 7 gap near $178 in view. #Nvidia #USStocks #TechnicalAnalysis
    Download
    00172
  7. Techno Funda Investing@TechnoFunda6
    🕯️ Candle Size = Momentum Clue 📈 Bigger candle bodies → momentum is building 📉 Smaller candle bodies → momentum is fading 🔍 Want to understand Advanced Candlestick Analysis? Read Advanced Technical Analysis Simplified 📖 👉 #TechnicalAnalysis
    Download
    101969
  8. Noah Feldman✓@IamLadyChelle
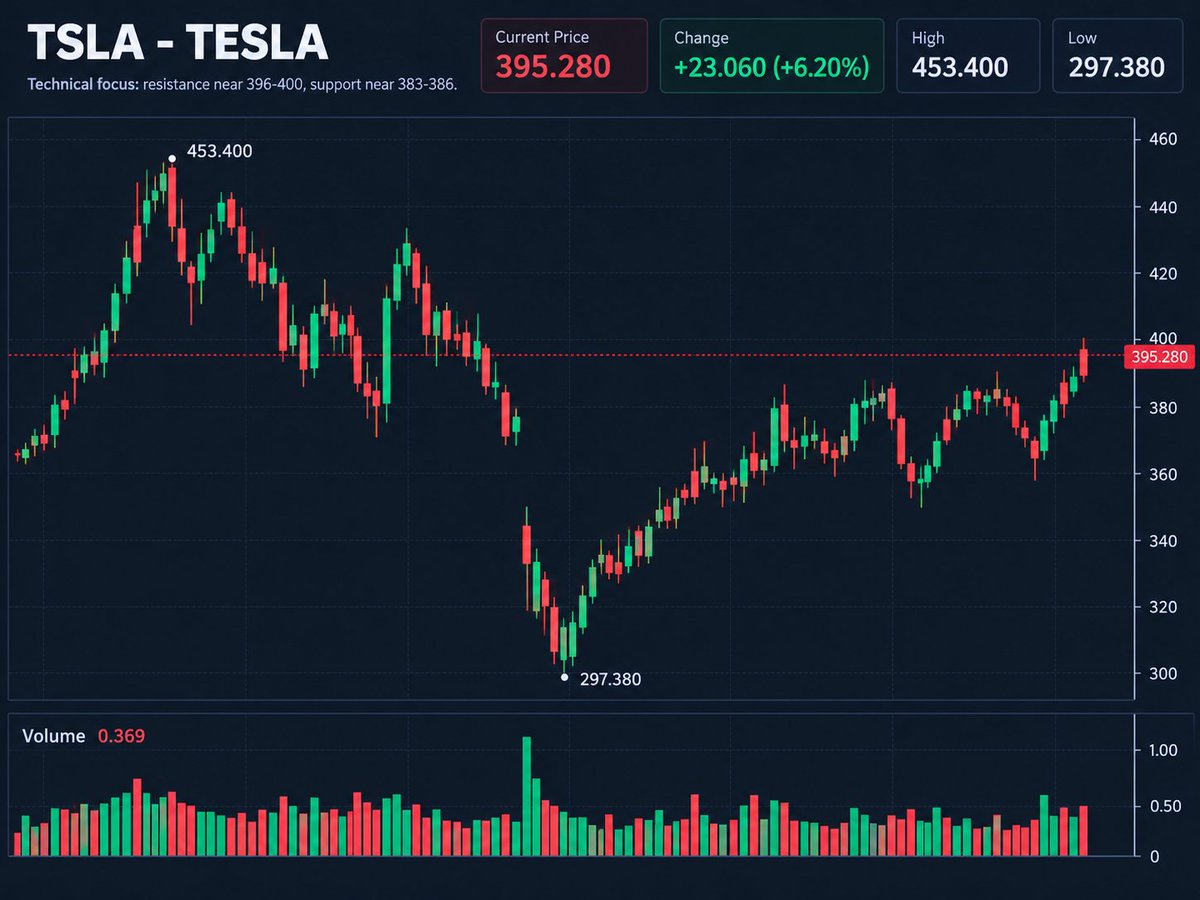
    My TSLA game plan: Watch $400 for a breakout and $383-$386 for support. Strong volume and a favorable risk-to-reward setup matter more than the daily gain alone. Follow me for more market updates and insights! #TSLA #TradingStrategy #TechnicalAnalysis
    Download
    00037
  9. Techno Funda Investing@TechnoFunda6
    One timeframe can hide bigger picture⏱️ Multi-timeframe analysis helps traders spot conflicting trends, avoid poor entries & make decisions with greater context. Learn more in Advanced Technical Analysis Simplified Book. 👉 #TechnicalAnalysis #Trading
    Download
    0031.1K
  10. Steve Burns✓@SJosephBurns
    Reactive Technical Analysis is about reading evidence, not predicting the future. • Price = What is happening right now • Trend = Directional bias • Volume = Participation • Volatility = Movement • Momentum = Speed • Support/Resistance = Key locations of price reversals • Relative Strength = Market Leadership • Invalidation = When you're wrong No signal guarantees an outcome. Read the evidence. Trade the probabilities. Define the risk. Stay flexible.
    192617724.2K
  11. Scott Redler✓@RedDogT3
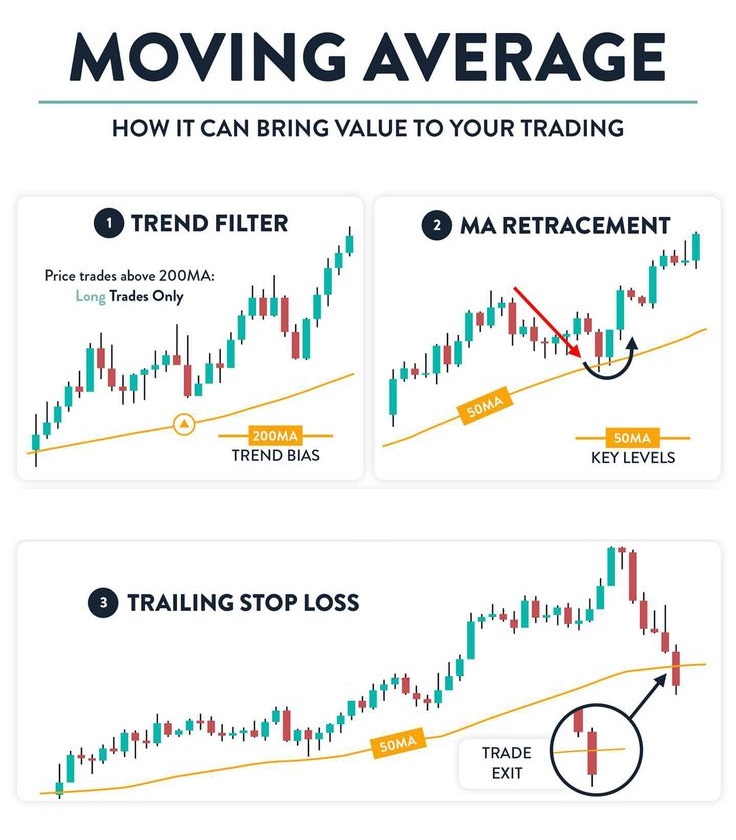
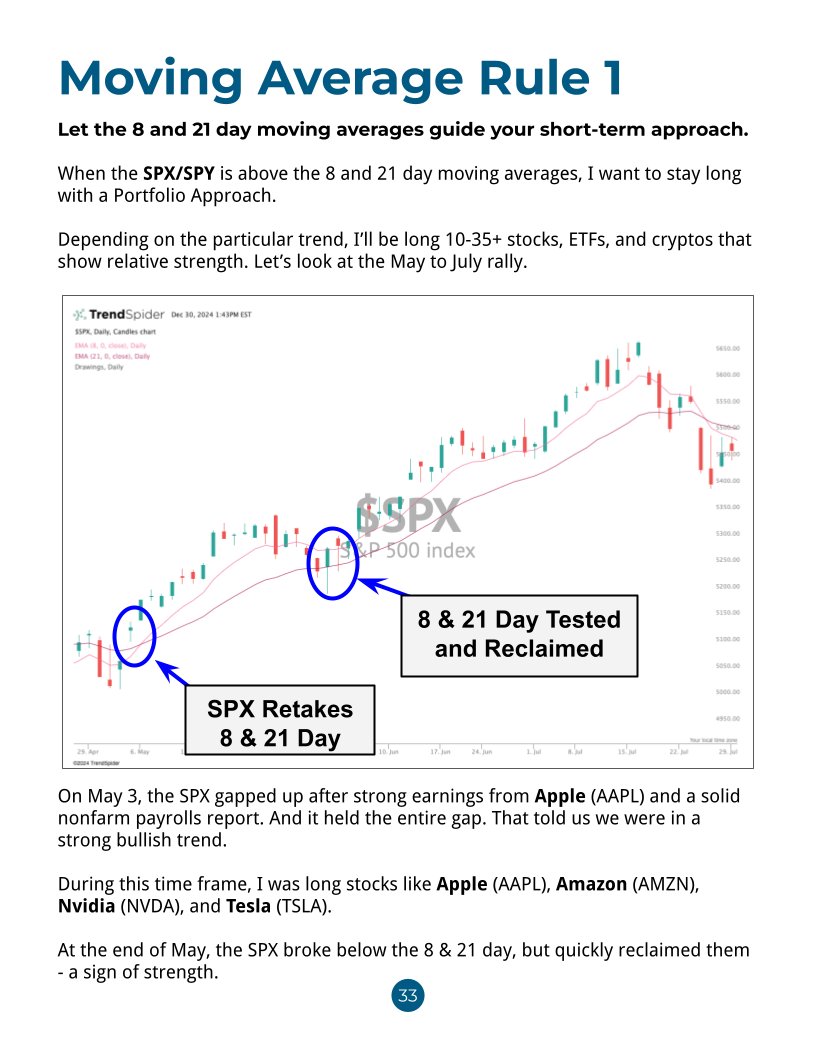
    The 8 & 21 day moving averages are key to my #technicalanalysis roadmap. Here's how to use them to avoid messes:
    Scott Redler @RedDogT3
    3 Moving Average Rules for Active Traders #1) Let the 8 and 21 day moving averages guide your short-term approach. When the SPX/SPY is above the 8 and 21 day moving averages, I want to stay long with a Portfolio Approach. Depending on the particular trend, I’ll be long 10-35+ stocks, ETFs, and cryptos that show relative strength. #2) Don’t fight stocks trending above the 8 & 21 day moving averages. Ride them! Want to go broke really fast? Bet against a stock trending above the 8 & 21 day moving averages. #3) When the SPX breaks the 8 & 21 day, Get Tactical. That means I start selling longs, starting with names showing relative weakness, and anything I’m not completely bullish on. Learn the system here:
    7116213.5K
  12. Scott Redler✓@RedDogT3
    3 Moving Average Rules for Active Traders #1) Let the 8 and 21 day moving averages guide your short-term approach. When the SPX/SPY is above the 8 and 21 day moving averages, I want to stay long with a Portfolio Approach. Depending on the particular trend, I’ll be long 10-35+ stocks, ETFs, and cryptos that show relative strength. #2) Don’t fight stocks trending above the 8 & 21 day moving averages. Ride them! Want to go broke really fast? Bet against a stock trending above the 8 & 21 day moving averages. #3) When the SPX breaks the 8 & 21 day, Get Tactical. That means I start selling longs, starting with names showing relative weakness, and anything I’m not completely bullish on. Learn the system here:
    Download
    4285575427K
  13. ThiccTeddy✓@ThiccTeddy
    TECHNICAL ANALYSIS MASTERCLASS📚📖 1) How to draw key levels 2) How to determine the strength of a trend 3) How to spot a reversal 4) How to trade a range Don't be lazy. Get 1% better today
    Download
    151641K44.4K
  14. Show more posts