56663728.2K
Posts with #Graph
#Graph
Public posts on X that use #Graph.
Related hashtags


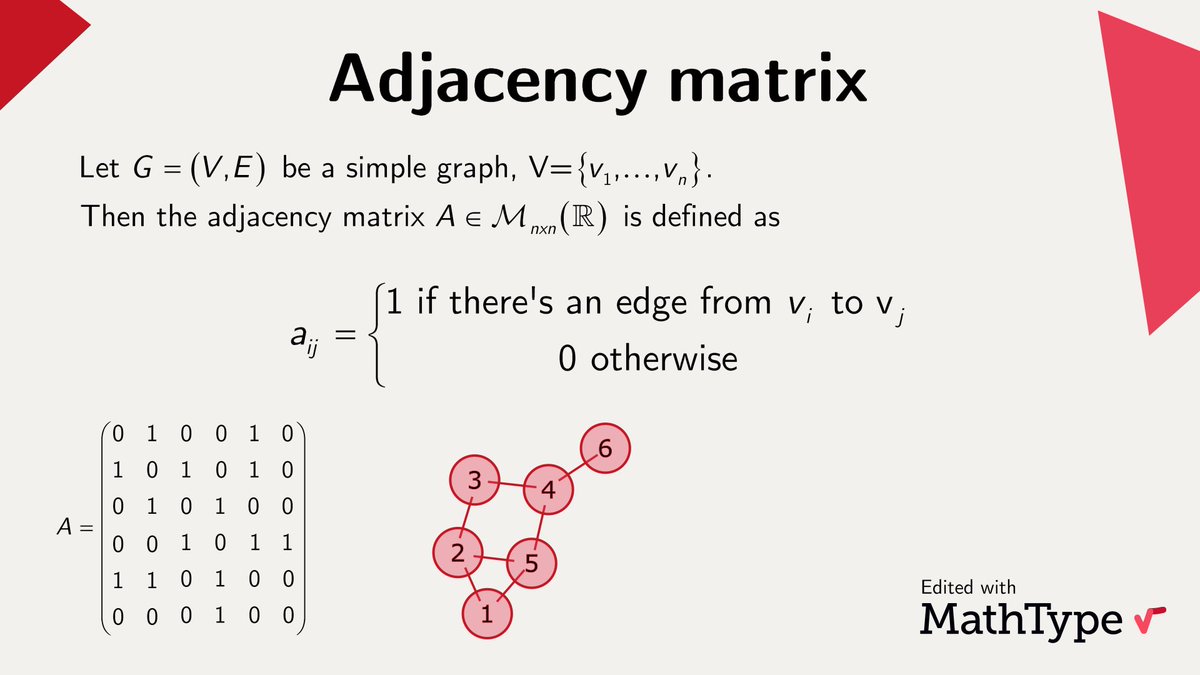
MathType@MathTypeAn adjacency matrix is a way of representing a finite #graph. The matrix elements indicate whether pairs of vertices are adjacent or not in the graph. The eigenvalues and eigenvectors of an adjacency matrix are studied in #spectral #GraphTheory. #MathType #math #mathfacts35328711.3K
MathType@MathTypeAn adjacency matrix is a way of representing a finite #graph. The matrix elements indicate whether pairs of vertices are adjacent or not in the graph. The eigenvalues and eigenvectors of an adjacency matrix are studied in #spectral #GraphTheory. #MathType #math #mathfacts46126615.5K
Chanin Nantasenamat@thedataprofCheck out this friendly step-by-step introductory tutorial to Graph Convolutional Neural Networks by José @napoles3D 👉 #graph #neuralnetwork #pytorch #pyvis369267
Data centers are estimated to have raised U.S. wholesale power prices by 6.9% by 2025, with impacts varying sharply by region ⚡ Created in partnership with the @_NPUC, this graphic maps modeled wholesale power price impacts across 23 U.S. regions using data from the Federal Reserve Bank of Dallas. #npuc265166711.4K
Almost everything I've written in twenty one years of GMI traces back to two things... debt and demographics. An ageing population means slower growth, and slower growth means more debt to paper over the gap. Thats The Everything Code. But something else is now sitting on top of it. AI, robotics, energy and crypto are all hitting their exponential curves at the same time. The Exponential Age is where the debt problem and the technology collide, and what comes out the other side is a very different world. This is seven minutes on how it all fits together. The long version is in my book, out 3rd November. And until tonight, when you preorder The Everything Code I’ll send you the September GMI report free. The issue is called The New Macro, and its about what that collision looks like right now. It looks at which risks the bears are pricing wrongly, which ones could actually derail it, and the five numbers that would tell me I'm wrong. GMI is normally members only, so this is the only way most people will ever read one. How to claim it below.4140345103K
GM CT Looking for a graphic designer to work on my X banner Reply with your portfolio, looking for the best of the best 💰114112165K
HOW TO RETIRE EARLY FROM THE AI STOCK CRASH IN THE NEXT 5 YEARS Do not MISS this. This is the exact build out to follow. After 14 years of trading, I’ve learned something: The biggest opportunities often appear when nobody wants to touch these stocks anymore. But a stock being down 50% doesn’t automatically make it cheap. Here’s where I’ll be looking once the market confirms a bottom: 1. AI & INFRASTRUCTURE Hyperscalers: $AMZN AI Chips: $NVDA Chip Design: $SNPS Foundries: $TSM Memory / HBM: $MU Networking: $ANET Photonics: $LITE Interconnects: $APH Edge AI: $QCOM Data Centers: $IREN Cooling: $VRT Servers: $DELL Storage: $PSTG GPU Cloud: $CRWV Digital Infrastructure: $EQIX Cloud Software: $NET Construction: $FIX Cybersecurity: $CRWD 2. POWER & RESOURCES Utilities: $AEP Grid: $PWR Electrical Equipment: $ETN Power Producers: $CEG Gas / Turbines: $GEV On-Site Power: $BE Energy Storage: $EOSE Nuclear: $OKLO Uranium: $CCJ Copper: $FCX Lithium: $ALB Critical Minerals: $LAC Rare Earths: $MP 3. THE NEXT INDUSTRIAL REVOLUTION AI Applications: $PLTR Robotics: $TSLA Industrial Automation: $ROK Autonomy: $GOOGL Drones: $AVAV Defense: $KTOS Space: $SPCX Quantum: $IONQ AI Healthcare: $TEM HERE’S WHAT I’M WAITING FOR: Selling pressure to exhaust. Strong stocks to form bases. Daily and weekly 8/21 EMA trends to turn bullish. Breakouts followed by successful retests. I’m not trying to catch the exact bottom. I’m looking for the NEXT major uptrend. THE FULL WATCHLIST IS IN THE GRAPHIC. Save this. Prepare now. Execute when the market confirms.3512280176.4K


Hannes Stark@HannesStaerkThis Tuesday in the #Graph ML reading group @matej_zecevic will present his paper "Relating Graph Neural Networks to Structural Causal Models" None less than @yudapearl said that this paper deserves attention! So join on Zoom! 1/2351238
MathType@MathTypeAn adjacency matrix is a way of representing a finite #graph. The matrix elements indicate whether pairs of vertices are adjacent or not in the graph. The eigenvalues and eigenvectors of an adjacency matrix are studied in #spectral #GraphTheory. #MathType #math #mathfacts35739017.9K
For anyone using Grok Bot or Claude to make video edits, there are a few things nobody seems to be doing. This is a small clip from an upcoming video of mine. FIXES: graphics pinned to the screen instead of the scene, dark scenes that break into bands and blocks on X and YouTube, numbers that jiggle while they count, and soft shots that don't match the rest of the edit. 👾Graphics pinned to the screen instead of the scene The top half of this video has its graphics pinned to the screen the way most edits do, and the bottom half has them locked to the world. When the camera moves, a label that points at something stays where it was and the picture slides out from under it. NASA Ames tested this with pilots in 1995. Landing in a simulator, they took 2.5 seconds longer to react to a plane on the runway when their flight symbols were on the head-up display instead of the instrument panel. Their explanation was that symbols on the glass don't move the way the world outside does, and that difference pulls attention onto them. Their fix was to draw the symbols as objects in the world so they move with it, and pilots flew their path more accurately. In an edit, that means tracking how the background moves in each shot, ignoring the people in it, and moving every graphic that points at something along with the camera. A label on a target follows the target, and titles and counters stay fixed. 👾Dark scenes that break into bands and blocks on X and YouTube: X and YouTube compress what you upload, and the smooth gradients in dark footage turn into bands and blocks. The fix is to smooth those gradients before the grain goes on. 👾Numbers that jiggle while they count: Counters jiggle because the digits in a lot of fonts are different widths, so the number shifts sideways as it counts. Putting each digit in a fixed-width slot keeps it still. 👾Soft shots that don't match the rest of the edit: Measure the sharpness of every shot too. The softest one stands out next to the shots around it, and that's the one to regenerate.868777044K
Ranked: The Top Currencies Used in Global Payments 💱 This graphic by Aneesh Anand is one of the many incredible data-driven charts and stories from creators featured on our @VoronoiApp. ✅13712114K
It's worth watching the narrated graphic animation. It explains a lot about where we are now, why and where we are going. Not super easy to see on your phone but hopefully worth it. 35 years of work compressed into 7 minsRaoul Pal @RaoulGMIAlmost everything I've written in twenty one years of GMI traces back to two things... debt and demographics. An ageing population means slower growth, and slower growth means more debt to paper over the gap. Thats The Everything Code. But something else is now sitting on top of it. AI, robotics, energy and crypto are all hitting their exponential curves at the same time. The Exponential Age is where the debt problem and the technology collide, and what comes out the other side is a very different world. This is seven minutes on how it all fits together. The long version is in my book, out 3rd November. And until tonight, when you preorder The Everything Code I’ll send you the September GMI report free. The issue is called The New Macro, and its about what that collision looks like right now. It looks at which risks the bears are pricing wrongly, which ones could actually derail it, and the five numbers that would tell me I'm wrong. GMI is normally members only, so this is the only way most people will ever read one. How to claim it below.62524467K- Show more posts