Peter Lindström

@plmlindstroem

Head of Quant Strategies & Research in BW Product Services. Views/insights/comments are not to be considered as financial advice.

  • Oslo, Norway
  • Joined
652 Following5.7K Followers3.9K Posts
  1. Peter Lindström@plmlindstroem
    Flattish VLGC Spot rates. LPG3 (USG -> JP) TCE +0k to 186k➡️ LPG1 (Arabian Gulf - CN) +4k to 246k➡️ $BWLP $LPG
    Download
    03131.3K
  2. Peter Lindström@plmlindstroem
    Flattish Dirty tanker spot rates mostly flattish➡️ FFA down⬇️ VLCC TD3C FFA Nov/Dec down 7/4%⬇️ TD3C TCE (AG>CN) +7k to 1,312k➡️ TD22 TCE (US>CN) +5k to 448k➡️ SUEZ TCE -8k to 624k➡️ AFRA TCE -11k to 326k↘️ BWET -4%⬇️ $HUNT $CAPT $DHT $ECO $FRO $BWET #OOTT
    Download
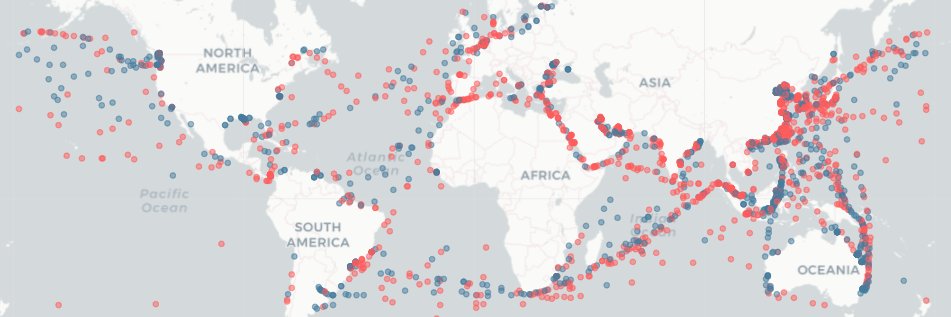
    15391.8K
  3. Peter Lindström@plmlindstroem
    Peter Lindström
    RT @TommyDeepwater: Also, Noble Endeavor semisub scheduled to begin work in the Falkland Islands in January ‘27 Argentina is threatening sanctions to companies involved Argentina not a hotbed for offshore drilling but has potential despite Argerich-1 dry well in ‘24. Noble will risk 🇦🇷 sanctions?
    010141
  4. Peter Lindström@plmlindstroem
    Peter Lindström
    RT @TommyDeepwater: Noble’s 7G BlackHawk moving from US Gulf to Uruguay for 1 exploration well in 4Q27 for APA The $500k dayrate not as significant bc it’s only 50 days but Uruguay has significant exploration interest from APA, Shell, Chevron, YPF, Eni — more work could follow in 2028
    010140
  5. Peter Lindström@plmlindstroem
    Peter Lindström
    RT @CommodMkt: Higher for longer - that was the core message in my discussion with @CNBC Squawk Box Europe this morning. Everyone is focused on the spot price of oil. But look further out: calendar 2027 Brent is holding around $97 a barrel. That’s close to $100 priced in for an entire year, not simply a short-term spike. That has implications for everything from industrial and agriculture production to transportation costs and inflation in the months ahead. Now look at energy equities. The Munificent 7 are hitting all-time highs as the back end of the oil curve approaches $100. This is looking increasingly structural, not transient. It's the Revenge of the Old Economy in action. The old economy is short-duration, asset-heavy and benefiting from higher commodity prices, whereas the new economy is long-duration, asset-light and increasingly exposed to higher interest rates and inflation. The irony in all this is that the old economy is fuelling the new economy. AI needs electricity, transformers, copper, high-voltage cables and critical minerals. None of that exists without the physical world. ‘Generalists’ in the market are beginning to recognise what specialists across the physical economy has been telling us for some time: higher for longer isn't just centred on bottlenecks and disruption to the flow of hydrocarbons out of the Strait of Hormuz. Instead, it’s a structural shift that is likely here to stay. We’re electrifying the world for many reasons, chief among them the so-called energy transition. The original driving force of the transition, led by the Carter administration, wasn’t the need to adopt clean energy with climate change in mind; it was driven by an urgent need for energy security in response to the oil shocks of the 1970s. We’re seeing a repeat today: the crisis in the Strait of Hormuz and bottlenecks elsewhere, impacting our ability to source and transport hydrocarbons, is forcing states to turn to electrification. Great discussion with @cnbcKaren and Steve Sedgwick - thank you for having me on.
    0690135
  6. Peter Lindström@plmlindstroem
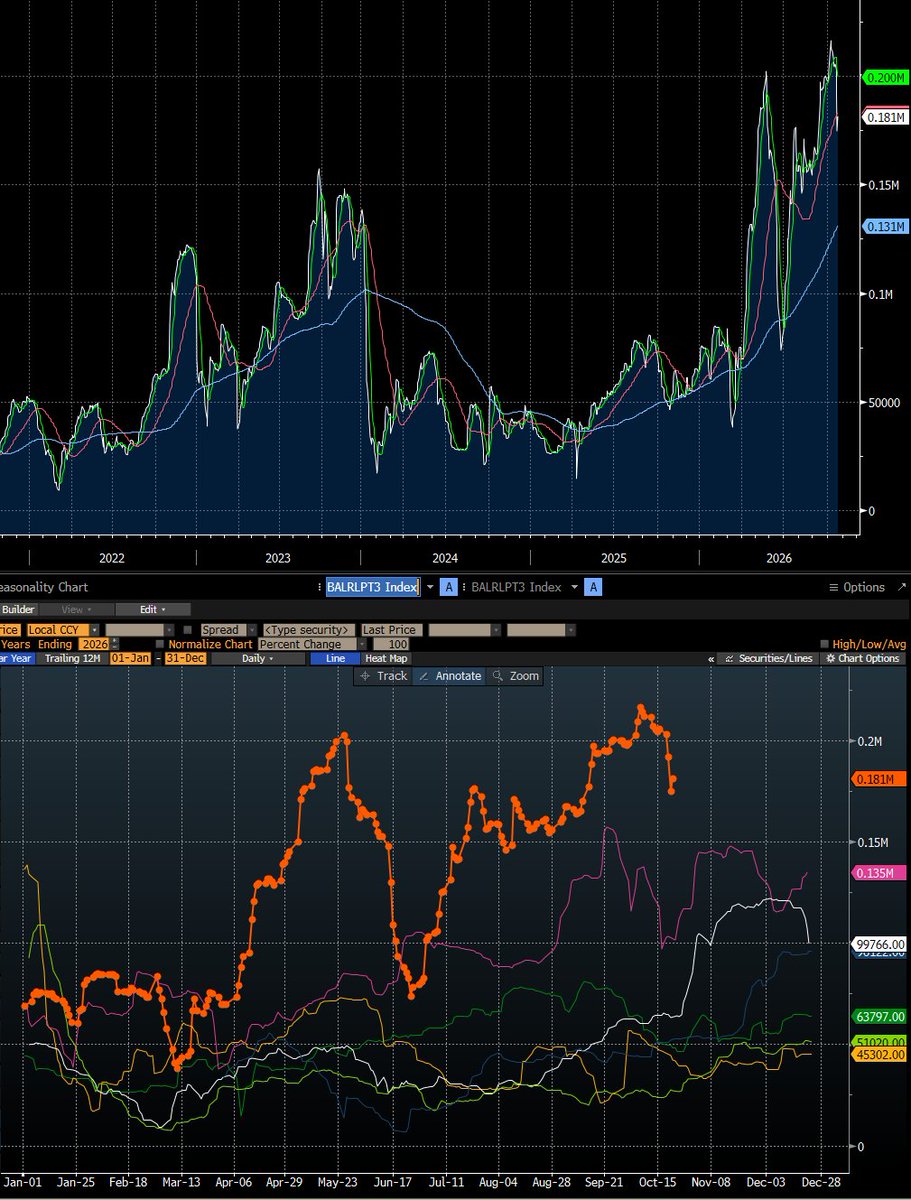
    VLGC Spot rates and FFA tick up. The arb is fairly flattish today. LPG3 (USG -> JP) TCE +2k to 186k➡️ LPG1 (Arabian Gulf - CN) @ 242k as of Thursday. $BWLP $LPG
    Download
    04301.8K
  7. Peter Lindström@plmlindstroem
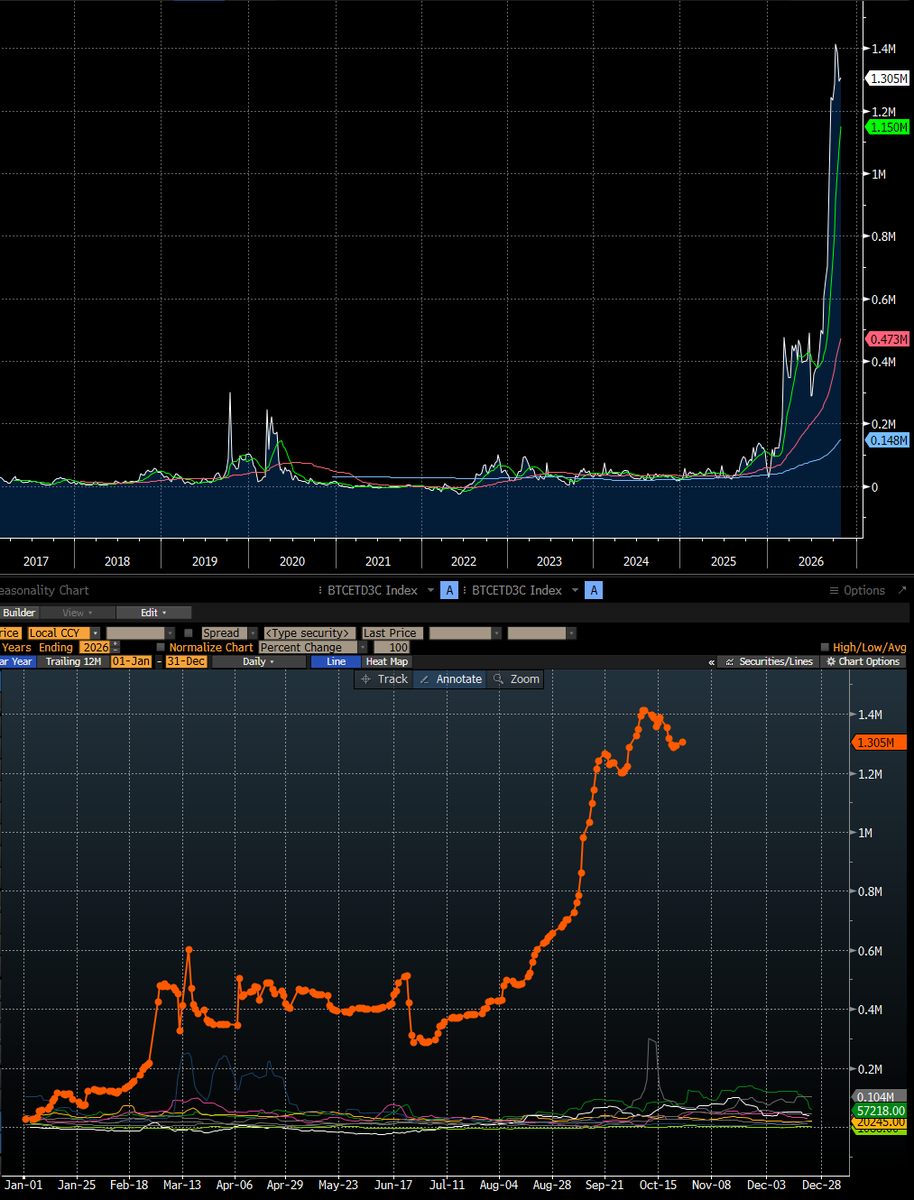
    Flattish Dirty tanker spot rates➡️ …which means that an FFA curve in backwardation goes up↗️ VLCC TD3C FFA Nov/Dec up 3-4%↗️ TD3C TCE (AG >CN) +11k to 1,305➡️ TD22 TCE (US>CN) -0k to 443k➡️ SUEZ TCE -6k to 633k➡️ AFRA TCE +1k to 337k➡️ $HUNT $FRO $ECO $DHT $CAPT $BWET #OOTT
    Download
    38582.9K
  8. Peter Lindström@plmlindstroem
    VLGC Spot rates tick up. The arb has widened further today and we end the week higher than where we started. LPG3 (USG -> JP) TCE +3k to 184k➡️ LPG1 (Arabian Gulf - CN) @ 242k as of Thursday. $BWLP $LPG
    04412K
  9. Peter Lindström@plmlindstroem
    Flattish Dirty tanker spot rates➡️ …and flattish FFA➡️ VLCC TD3C FFA Nov/Dec up 2%↗️ BWET flat➡️ TD3C TCE (AG >CN) +7k to 1,295➡️ TD22 TCE (US>CN) -9k to 443k➡️ SUEZ TCE -0k to 638k➡️ AFRA TCE +9kto 336k➡️ $HUNT $FRO $ECO $DHT $CAPT $BWET #OOTT
    14472.1K
  10. Peter Lindström@plmlindstroem
    Peter Lindström
    RT @CRUDEOIL231: Hormuz LNG still way behind crude recovery, leaving global LNG balances tethered to USGC now. Asia & Europe better hope this winter isn't freezing. Good luck 🥹
    0410142
  11. Peter Lindström@plmlindstroem
    VLGC Spot rates for US loading recoups some of yesterday's losses as the arb is widening again. Crazy volatility in arb and freight so far this week. LPG3 (USG -> JP) TCE +6k to 181k (picture)↗️ LPG1 (Arabian Gulf - CN) -8k to 242k↘️ $BWLP $LPG
    Download
    22281.7K
  12. Peter Lindström@plmlindstroem
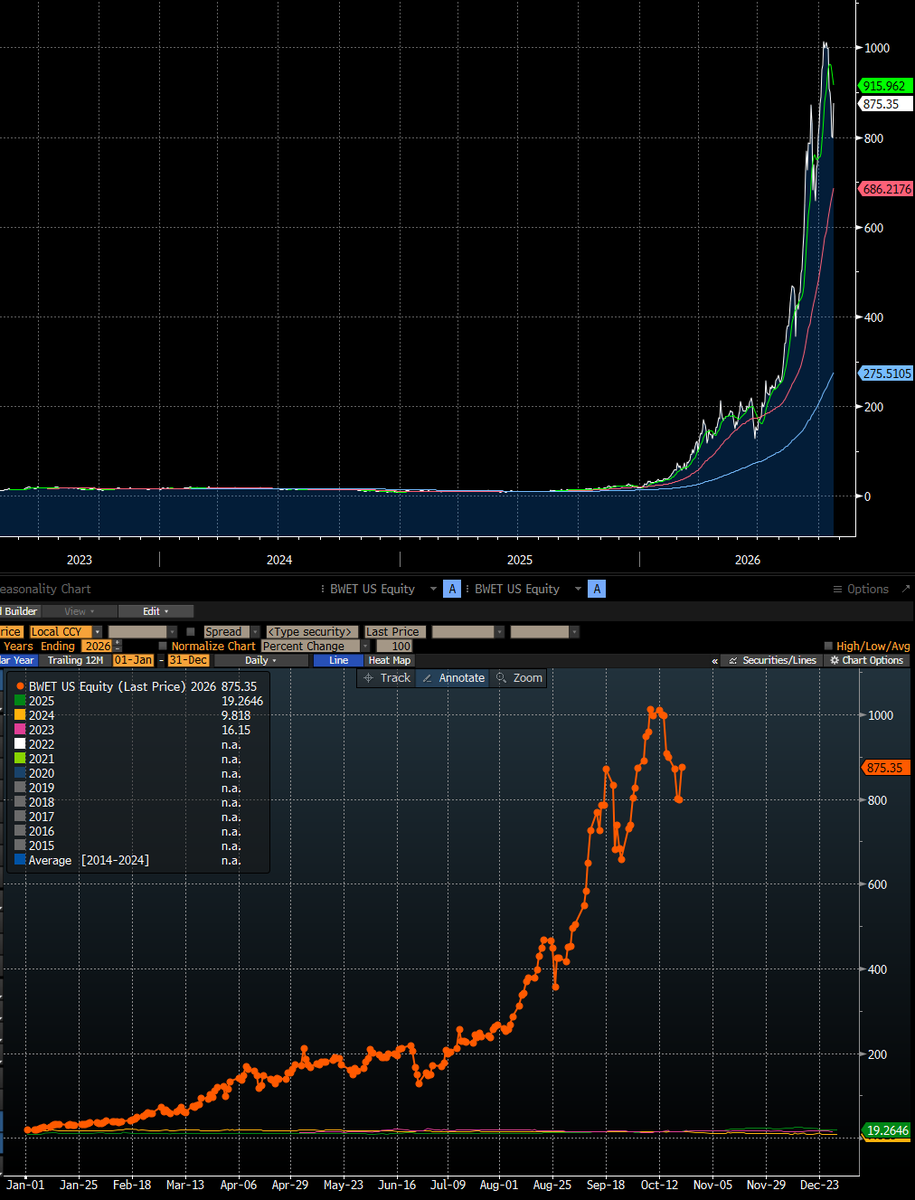
    Flattish Dirty tanker spot rates➡️ FFA rebounds🪃 VLCC TD3C FFA Nov/Dec/Q1 up 8%/6%/17%⏫ BWET up 10%🚀 (picture) TD3C TCE (AG >CN) -8k to 1,288k➡️ TD22 TCE (US>CN) -13k to 452k➡️ SUEZ TCE -2k to 639k➡️ AFRA TCE +4k to 327k➡️ $HUNT $FRO $ECO $DHT $CAPT $BWET #OOTT
    Download
    35642.7K
  13. Peter Lindström@plmlindstroem
    Peter Lindström
    RT @Rory_Johnston: We traded a glut of stranded oil on water in the Persian Gulf (left) for a dark shuttle logistical inefficiency-driven backup glut of oil on water in the Gulf of Oman (right). Data via Kpler.
    0260153
  14. Peter Lindström@plmlindstroem
    VLGC Spot rates moving down together with a rapidly narrowing US-FEI arb. LPG3 (USG -> JP) TCE -17k to 175k (picture)🐻 LPG1 (Arabian Gulf - CN) @ 250k as of Tuesday $BWLP $LPG
    Download
    01171.4K
  15. Peter Lindström@plmlindstroem
    Dirty tanker spot rates mostly down. VLCC TD3C FFA Nov/Dec up 2%↗️ TD3C TCE (AG >CN) -22k to 1,296k➡️ TD22 TCE (US>CN) -26k to 465k⬇️ SUEZ TCE -27k to 641k⬇️ AFRA TCE +2k to 323k➡️ BWET up 2%↗️ $HUNT $FRO $ECO $DHT $CAPT $BWET #OOTT
    Download
    09541.9K
  16. Peter Lindström@plmlindstroem
    Great charts by @TankerTrackers It is easy to understand why the dirty tanker market is at astronomical levels. IR export is ~ zero, we thus have a substantial net increase in exported barrels on compliant tonnage, and the tremendous inefficiencies of this trade comes on top.
    TankerTrackers.com, Inc. @TankerTrackers
    Middle East Crude Oil Exports Left: Past 7 days Middle: Past 28 days Right: Pre-War (58 days) Notice how much comes out of the Red Sea now vs pre-war. #OOTT #IranWar #Tankers
    21412.4K
  17. Peter Lindström@plmlindstroem
    Peter Lindström
    RT @CRUDEOIL231: Covered the last of our shipping shorts today and closed out the book. Tactical trades aren't usually my game, but this one printed a solid profit. Meanwhile the latest data out of Kpler's Matt Wright is a reality check for this market. Sanctions relief on paper tankers isn't going to break this structural freight squeeze. The problem right now isn't an outright shortage of hulls—it’s a severe shortage of tonnage with both the willingness and technical capability to transit the Middle East. Middle East VLCC ton-miles may have bounced back to 5yr avg, but they’re still sitting 34% below 2025 levels. Even ton-days—which far better capture the operational friction of STS lightering—remain down 24% versus pre-war baselines. STS operations have kept Gulf exports moving while capping transits through the Strait of Hormuz, but the system is decaying into pure operational inefficiency. The Gulf of Oman shuttle fleet has bloated to roughly 80 VLCCs, yet round trip voyage times are blowing out to 23 days—more than double the optimal 9-10 day Basrah-Sohar loop. With infrastructure and crew bottlenecks choking transfer volumes in the Gulf of Oman, STS ops are getting pushed out to West Coast India and Malaysia. Diverting via WCI tacks on roughly 4 days to the shuttle leg, while direct-discharge runs tie up hulls for significantly longer. About 50% of this Gulf of Oman shuttle armada is owned by Sinokor, with state-owned oil majors holding down most of the balance. This extreme ownership concentration leaves charterers bidding against a tiny, hardened pool of owners willing to sail into a hot zone—handing them immense pricing power at the fixture desk. As shuttle operations expand and strike risks escalate, charterers are running out of options. That is precisely why war risk premiums refuse to budge and freight rates won't cool off despite throwing more metal at the problem. For every incremental barrel of export capacity, the system burns through hulls at an accelerating rate. Surging bunkers and insurance have definitely jacked up voyage OPEX, but they still don't explain the full magnitude of this rate explosion. VLCC operating and voyage costs are up 140% y/y. Notable on paper but practically a rounding error against a 2,000% moonshot in spot freight. And remember that’s across the global fleet—Hormuz war insurance and crew danger pay sit well north of that figure. Bunkers dominate the cost stack. Regional conflict has sent bunker prices ripping, Singapore HSFO is up 134% to $890/mt, while VLSFO jumped 105% to $911/mt. That said standard VLCCs primarily burn heavy fuel, and with 62% scrubber penetration across the fleet, owners are somewhat insulated from the high sulfur spike. Cargo war risk insurance for Hormuz transits did reprice violently from $0.05/bbl to $3.50/bbl—a hefty jump, but still a fraction of a delivered cargo clearing well over $30/bbl. Astronomical Middle East earnings have killed owners' appetite to ballast into the Atlantic. Middle East TCEs are printing a massive premium of over $500k/day against Atlantic runs. Charterers in other basins are forced to compete against these insane Middle East fixtures, even when local physical fundamentals have zero business paying record freight. This dislocation launched US Gulf to Asia rates toward $40/bbl in recent weeks, forcing select West African stems to downsize from VLCCs onto Suezmaxes. This is textbook local disruption exporting systemic volatility to the global tanker complex. Rn the hard ceiling on dirty freight isn't the physic vessel count—it’s refinery margins. Heavily discounted Middle Eastern barrels have allowed Asian crack spreads to stay in the green despite monstrous freight bills. But Atlantic crude is a different story. Crushing transport costs have pushed select Asian margins into negative territory, pulling the rug out from under Atlantic VLCC fixtures. Atlantic VLCC rates look vulnerable to further downside, while Middle East runs will stay heavily bid, backstopped by war risk, constrained shuttle logistics, and superior cargo level netbacks. A mere normalization of Middle East export volumes won't fix these broken freight economics. Until physical security threats abate and fleet utilization unclogs, the Middle East will continue dictating global VLCC price discovery. #oott #iran
    0440129
  18. Peter Lindström@plmlindstroem
    VLGC Spot rates moving down together with a narrowing US-FEI arb. LPG1 (Arabian Gulf - CN) - 6k to 250k↘️ LPG3 (USG -> JP) TCE -11k to 192k⬇️ (picture) $BWLP $LPG
    Download
    04261.6K
  19. Peter Lindström@plmlindstroem
    Dirty tanker spot rates moving down. VLCC TD3C FFA Nov/Dec down 4%, Q1 down 6%⬇️ TD3C TCE (AG >CN) -35k to 1,318k↘️ TD22 TCE (US>CN) -24k to 491k⬇️ SUEZ TCE -13k to 668k➡️ AFRA TCE -3k to 320k➡️ BWET down 8%⏬ (picture) $HUNT $FRO $ECO $DHT $CAPT $BWET #OOTT
    Download
    33522.5K
  20. Peter Lindström@plmlindstroem
    Peter Lindström
    RT @chigrl: US Plan to Rehabilitate Dark Fleet Tankers May Find Few Takers A US plan to rehabilitate sanctioned tankers to boost oil supply may attract only a sliver of the dark fleet, as existing contracts, complex compliance checks and sky-high freight rates reduce incentives for would-be sellers. Under the US proposal, blacklisted vessels can be sold and rejoin the legitimate fleet, Energy Secretary Chris Wright said on Monday, adding the government would “convert” tankers to expand global availability but would not lift existing sanctions. He did not detail the sale process or potential investors. A wider plan would meet different hurdles — including the absence of financial incentives to sell up. Even though ships’ resale values have climbed in recent months, soaring freight rates mean that shipowners are still motivated to keep their vessels operating. Then there is age. Oil Brokerage, an independent energy broker, estimates that there are 294 sanctioned tankers free from EU or UK penalties — but 70% of them are above 20 years old and unpalatable to mainstream traders. That leaves just 75 commercially available tankers of all sizes, including 50 supertankers.
    0260162
  21. Show more posts