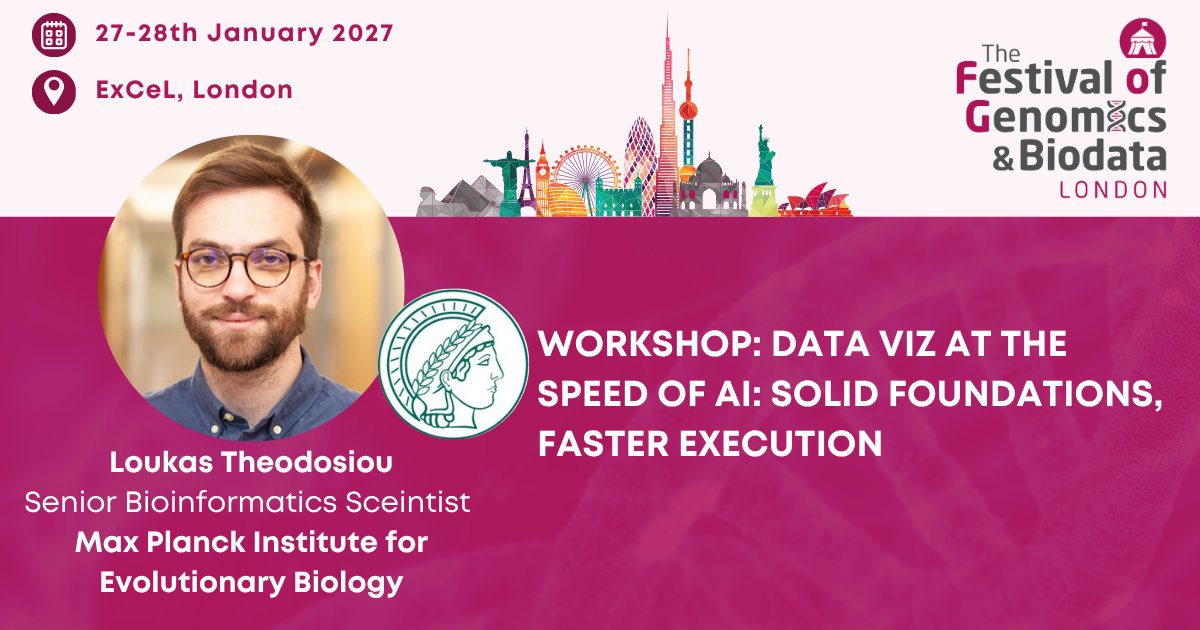
Make data visualisation faster with AI! Loukas Theodosiou (Max Planck Institute) leads a workshop on combining strong data viz foundations with AI-powered workflows at FOG London this January. Register here:
#FOG2027#DataVisualisation#AI
⚓ Our new website is coming soon!
Bring your data to life with bespoke dashboards, reliable hosting and expert support from Metric Harbour. Follow us for launch updates. 🚀
#MetricHarbour#DataVisualisation#ComingSoon
📊 Access data easily with Zizo Insight – no database skills required!
Analyse and visualise information effortlessly using drag-and-drop simplicity, empowering your team to make informed decisions faster.
🌐
#Zizo#Insight#DataVisualisation
Doesn't anyone remember using MS DOS? Here's a trip down memory lane. This #datavisualisation shows the rise and fall of desktop operating systems since 1978. It's a real trip down memory lane. Enjoy! #Technology#Microsoft#Windows#Linux
Nothing about #digitalisation is preditable. In just a few decades the digital economy has changed, reinvents itself and disrupts our lives. It’s exciting, exhilarating and slight frigtening to watch. That’s why I created this #datavisualisation.
#digital#economy#tech
Your next sales review could start with a shared dashboard.
Describe the charts and tables you need. Bilboard builds a working dashboard, ready to edit and share with your team.
Describe it. Bilboard renders it!
#Dashboards#DataVisualisation#Chart#Sales
What's the most effective way to teach data visualization? @lekovicj highlights the most salient points from members of the Data Visualization Society. #Datavisualization#datavisualisation
Hi #datafam
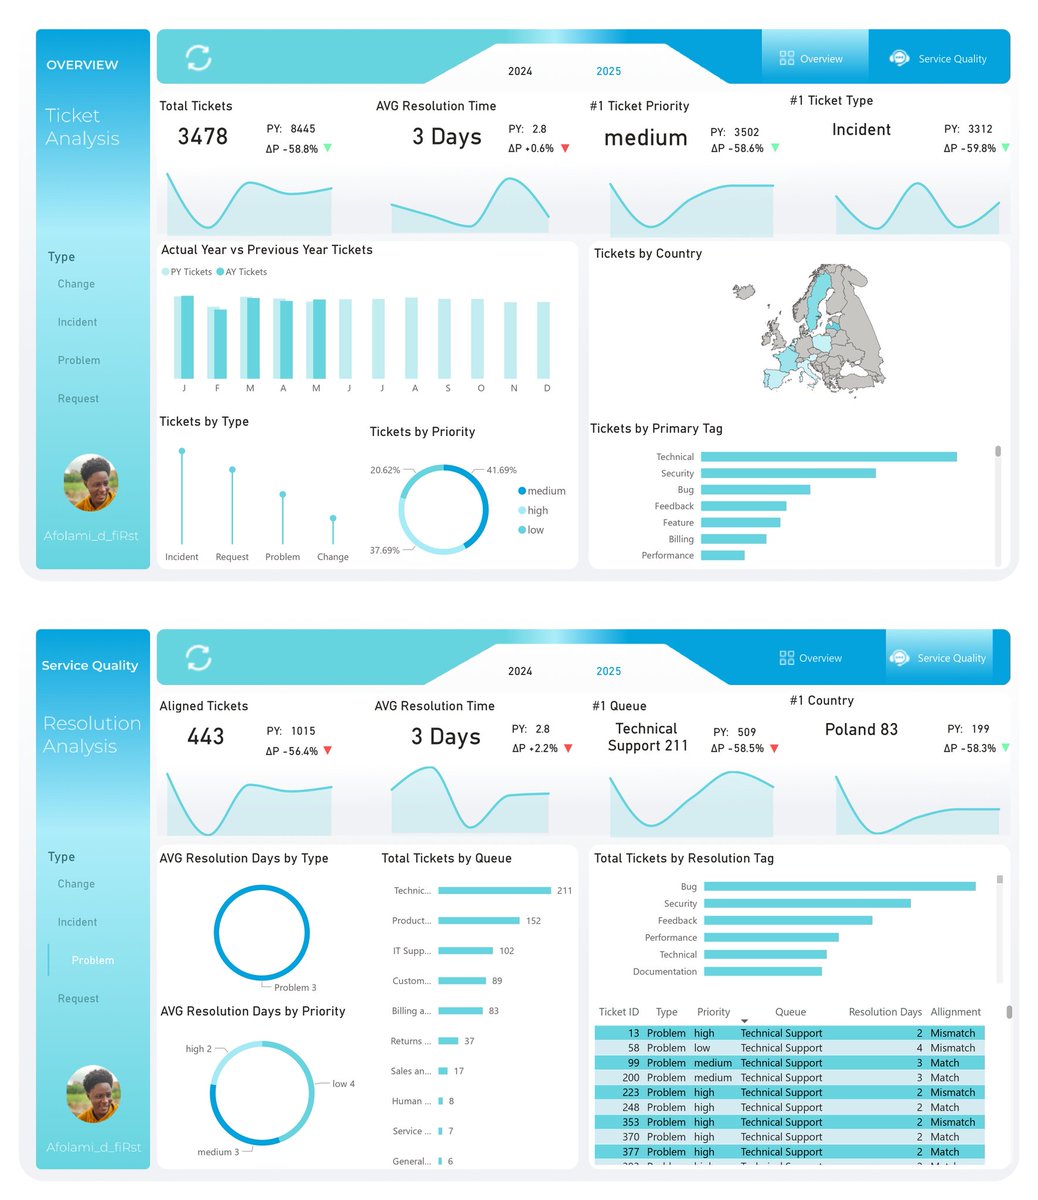
This is a Microsoft Power BI report analyzing IT service desk performance, focusing on ticket volume, resolution times, and service quality across different countries and ticket types.
#DataAnalytics#datavisualisation#MSPowerBI