Posts with #rioxarray

#rioxarray

Public posts on X that use #rioxarray.

Related hashtags

  1. Ujaval Gandhi@spatialthoughts
    Want to level up your #Python Dataviz skills? I am launching our Mapping and Data Visualization with Python course on YouTube and designed a free #PythonDatavizChallenge where you spend 30 mins a day for the next 30 days to learn a new skill. Start at
    Download
    413663131.6K
  2. Ujaval Gandhi@spatialthoughts
    @spatialthoughts
    Now that you have learnt how to create globe maps using #CartoPy and Orthographic projection, you can apply the same to the solar eclipse dataset and create a globe visualization for the same.
    105644
  3. Ujaval Gandhi@spatialthoughts
    Spent the Christmas break playing with the recently released #LISS4 satellite imagery from #ISRO and am happy to share #Python open-source code using #XArray and #Dask for fast parallel processing of large datasets. A thread with details (1/n)
    Download
    12718221K
  4. Ujaval Gandhi@spatialthoughts
    @spatialthoughts
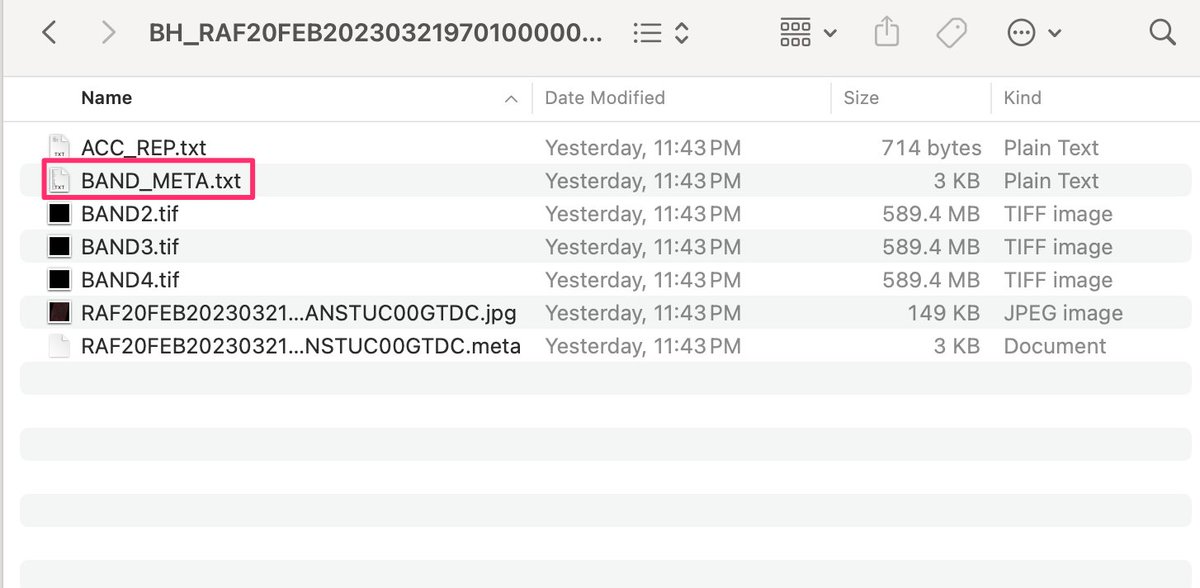
    The scenes contain 3 individual GeoTIFFs for each of Green, Red and NIR bands. There's a text file with metadata. The scene swath is 70km and each band is ~500MB of data. (2/n)
    Download
    1041.2K
  5. Ujaval Gandhi@spatialthoughts
    @spatialthoughts
    Working with large files like these can be tricky with traditional Python libraries like rasterio. You can easily run out of RAM and processing is slow. The #XArray ecosystem makes it a pleasure to work with the data. We read the bands using #rioxarray. (3/n)
    Download
    10101.2K
  6. Robert Reny@RobertReny4
    How stable are NAIP-derived urban land use classifications overtime? ~Apparently~ not very stable 😓Here we track NAIP pixels that were classified as grass in 2016 and follow their classifications in 2018 and 2020.
    Download
    203
  7. Robert Reny@RobertReny4
    @RobertReny4
    Was hoping to see a bit more stability but different timing of imagery and weather may explain that. Note how so much of 2016 grass becomes 2018 trees and 2018 grass becomes 2020 trees. Just putting it out there - thoughts are welcome!
    101
  8. Dr Robbi Bishop-Taylor 🦋@SatelliteSci
    @SatelliteSci
    The particularly nice thing here is the new standardised `.odc` accessor that's added to every `xarray` object, allowing you to easily inspect, manipulate and transform data loaded by @OpenDataCube and #rioxarray. For example, inspecting geospatial metadata for a dataset:
    Download
    101
  9. Ujaval Gandhi@spatialthoughts
    Happy to announce my new course Mapping and Data Visualization with #Python. This has been in the making for over a year and excited to be able to share it with the world! The full course is free for self-study and shared under an open license. An overview thread below 👇 1/n
    404732.1K
  10. Ujaval Gandhi@spatialthoughts
    @spatialthoughts
    Day 2 starts with a deep dive into XArray and raster data visualization. We use #Xarray, #rioxarray and #CartoPy to visualize elevation and gridded climate datasets and learn some advanced #Matplotlib tricks. (3/n)
    Download
    1547
  11. Show more posts